Bank of America (BAC) Stock Falls 0.70% (November 19, 2026): Down 3.8% in Five Sessions
Technical analysis of BAC stock on November 19, 2026: price 48.57 USD, trend downtrend, RSI 33.6, support 48.57, resistance 51.63.
Why BAC is in focus today
Selected automatically from 11 NYSE (US) stocks by a technical-signal score with daily weighted randomisation — not a recommendation.
Trend & Price Action
The price structure is unambiguous. BAC trades below its 20-day average of $50.21 and well below its 50-day average of $53.00, and the 20-day average itself is falling, declining 0.60% over the past five sessions. That combination — price under both averages, with the shorter average slipping — is the textbook definition of a downtrend in progress; the data shows no fresh moving-average cross, which means this is a trend that has been building rather than a one-day break. The most telling detail is Bollinger placement. The stock’s %B reading of -4% means it closed below the lower band of $48.69, not merely near it. In plain terms, the lower band marks where prices have historically stopped falling relative to their recent average, and a close beneath it signals selling pressure strong enough to break that habit. The band width of 6.1% is narrowing — a squeeze — which normally precedes a sharp directional move. The squeeze has effectively resolved downward.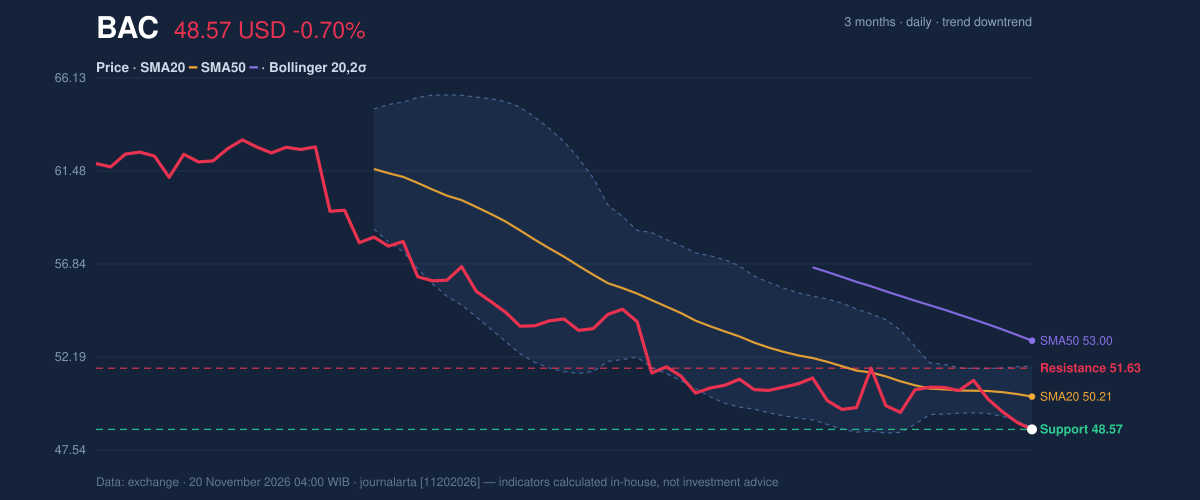
Oscillators & Momentum
Momentum is split, and the split is the story. RSI(14) at 33.6 sits close to the oversold threshold of 30 but remains technically in neutral territory. Stochastic is more advanced: %K at 10.4 and %D at 7.8 are both deeply oversold. Meanwhile MACD printed -1.009 against a signal line of -1.067, leaving a positive histogram of 0.058 — a thin but real sign that downside momentum is decelerating even as price makes lows.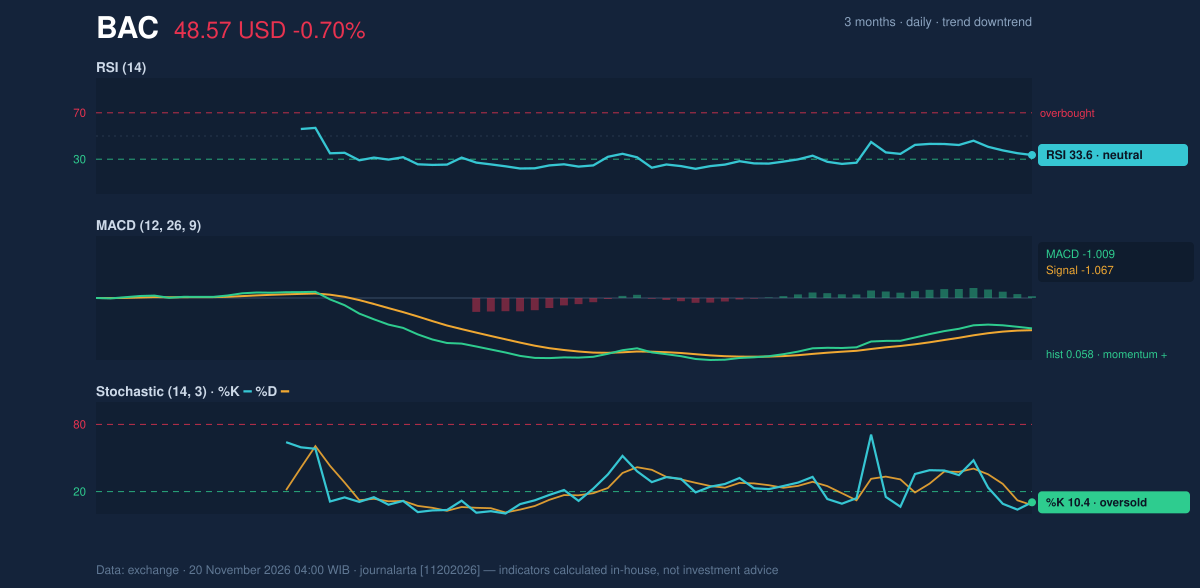
Volatility & Volume
ATR(14) of 1.21, or 2.5% of the share price, describes moderate volatility — wide enough that a $1 move is routine, which matters when judging whether the $48.05 low will hold. Volume at 35.75 million shares ran at 1.0x the 20-day average of 34.20 million, so the decline is not a low-liquidity artifact; participation is normal. But On-Balance Volume is falling, meaning cumulative volume flow is tilted toward sellers. That divergence — ordinary volume with negative OBV — tells us the selling is persistent rather than a single forced liquidation.Key Levels & Scenarios
The immediate battleground is clear. If BAC holds above the 20-day support at $48.57, an oversold bounce toward the 20-day average at $50.21 is conceivable, with the lower Bollinger band at $48.69 as the first tripwire. A close back above $50.21 would begin to repair the trend. Conversely, if the stock loses $48.05 — the three-month low — the squeeze's downside resolution extends, and the next reference points are the framework levels below. For now, price sits at the bottom of its range with the average above it, which favors the breakdown scenario.Fundamental Context
The technical weakness contrasts with a still-profitable franchise. Bank of America reported quarterly revenue of $29.96 billion for the quarter ended September 30, 2026, up 3.2% from $29.04 billion a year earlier, according to its SEC filing. Net income was $6.93 billion, down from $8.33 billion a year earlier, with diluted earnings per share of $0.91. Solid top-line growth paired with lower earnings is the kind of mixed print that leaves the stock hostage to rate and credit expectations — precisely the backdrop in which technicals tend to drive short-term direction.Technical Verdict: SELL
The verdict is SELL, consistent with the JournalArta research signal of -84 on a -100 to +100 scale. Three reasons carry the call: price is below its 50-day average and the 20-day average is below the 50-day — a confirmed downtrend; the Bollinger squeeze has resolved with a close below the lower band at %B of -4%; and OBV is falling while volume runs at normal levels, confirming seller participation. The oversold Stochastic at 10.4 and positive MACD histogram are bounce risks, not trend changers. - Sell zone: $48.57 – $49.47 - Exit target 1: $45.48 - Exit target 2: $42.39 - Stop loss: $50.63 - Reward/risk: 1.5 / 3.0 - Invalidation: a close above the $50.63 stop, or recovery back above the 20-day average at $50.21 In plain English: the chart is pointed lower, and the most likely path is further weakness before any durable recovery, with the stop above the 20-day average defining where that view would be wrong. The next scheduled catalyst is the expiry of this technical setup on December 18, 2026, by which point either the $48.05 floor breaks or the oversold rebound has had its chance to develop. *This is technical analysis for educational purposes, not an investment recommendation. Data as of the November 19, 2026 session.*Summary Data BAC
| Last price | 48.57 USD |
| Change 1 day / 5 days / 1 month | -0.70% / -3.84% / -4.91% |
| Trend / MA-cross | downtrend / none |
| SMA20 / SMA50 | 50.21 / 53.00 |
| RSI (14) / Stochastic %K | 33.6 / 10.4 |
| Bollinger %B / ATR | -4% / 1.21 |
| Support / Resistance 20 days | 48.57 / 51.63 |
| Data as of | 20 November 2026 04:00 WIB |
| JournalArta research verdict (score) | Sell (-84) |
| Sell zone | 48.57 – 49.47 |
| Target 1 / 2 | 45.48 / 42.39 |
| Stop loss | 50.63 |
| Reward/risk | 1.5 / 3.0 |
Today's full Buy and Sell list for US stocks →
Disclaimer: This technical analysis is generated automatically from exchange data and indicators calculated by JournalArta, for information and education only. The verdict and the entry, target and stop-loss levels are not investment advice or a solicitation to buy or sell any security. Investment decisions and their risks rest solely with the reader.
Track BAC stock price daily: live levels, support/resistance and our full BAC analysis history.
 Take the quizWhat Kind of Holiday Spender Are You? Take the Black Friday QuizStart →





 Lifestyle · Food & HealthNormal Blood Pressure Chart by Age: Healthy Ranges Explained
 Lifestyle · Food & HealthWhat Is Raynaud’s Syndrome? Why Fingers Turn White in the Cold
 Lifestyle · Food & Health4 Ways Walking After Meals Helps Your Body, Doctors Say
 Lifestyle · Food & Health4 Reasons to Eat Oatmeal, According to Nutrition Experts