Visa Stock Slides 3.12% (November 19, 2026): Down 4.3% in Five Sessions
Technical analysis of Visa stock on November 19, 2026: price 402.25 USD, trend sideways, RSI 43.9, support 400.60, resistance 436.57.

Why Visa is in focus today
- One-day move of 0.00%, about 0.0× its average daily range (ATR)
Selected automatically from 11 NYSE (US) stocks by a technical-signal score with daily weighted randomisation — not a recommendation.
Trend & Price Action
The structural picture is more divided than the headline drop implies. Visa closed below its 20-day average of $417.19, yet it remains firmly above its 50-day average of $394.01 — a configuration that keeps the medium-term uptrend intact even as short-term momentum cools. The 20-day average itself has been creeping higher, rising 0.63% over the past five sessions, a sign the broader trend has not rolled over. No fresh moving-average cross has formed, so this is a pullback within a range rather than a trend reversal. Position within the range matters. With the stock sitting just 5% above the 20-day floor, it is closer to support than to the ceiling near $436.57. The three-month span runs from $356.75 to $442.23, placing the current price in the lower-middle of that band. The setup the screening process flagged — a pullback toward the 20-day average while price holds above the 50-day — is a classic buy-the-dip formation in an uptrend, but it needs price confirmation before it means anything.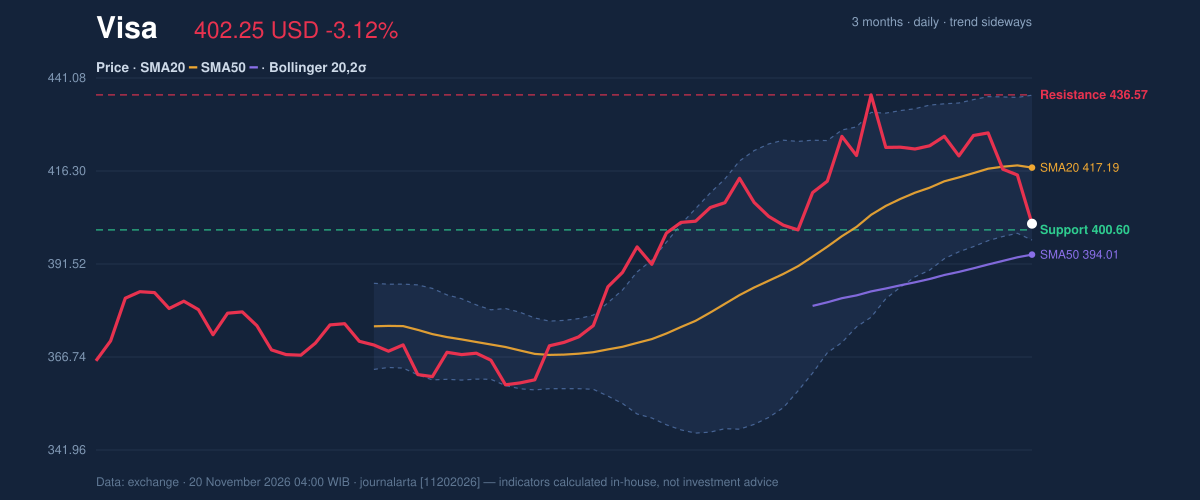
Oscillators & Momentum
Momentum indicators are where the caution lives. The 14-day RSI at 43.9 is neutral, sitting below the 50 midpoint but nowhere near oversold territory. The Stochastic is far more stretched: %K at 3.6 against %D at 16.2 puts the fast line deep in oversold ground, a reading that often precedes a short-term bounce but can also signal persistent weakness when the trend is down. MACD is the clearest negative voice — the line at 5.677 sits below its signal at 8.841, with a histogram of -3.164 confirming momentum has turned negative. The divergence between trend and momentum is the core tension. Trend structure says the stock is still in an uptrend above its 50-day average; momentum says the near-term path of least resistance is lower. Until those two align, rallies are more likely to be sold than chased — and that misalignment is exactly why the research framework lands on a wait-and-see stance rather than a directional call.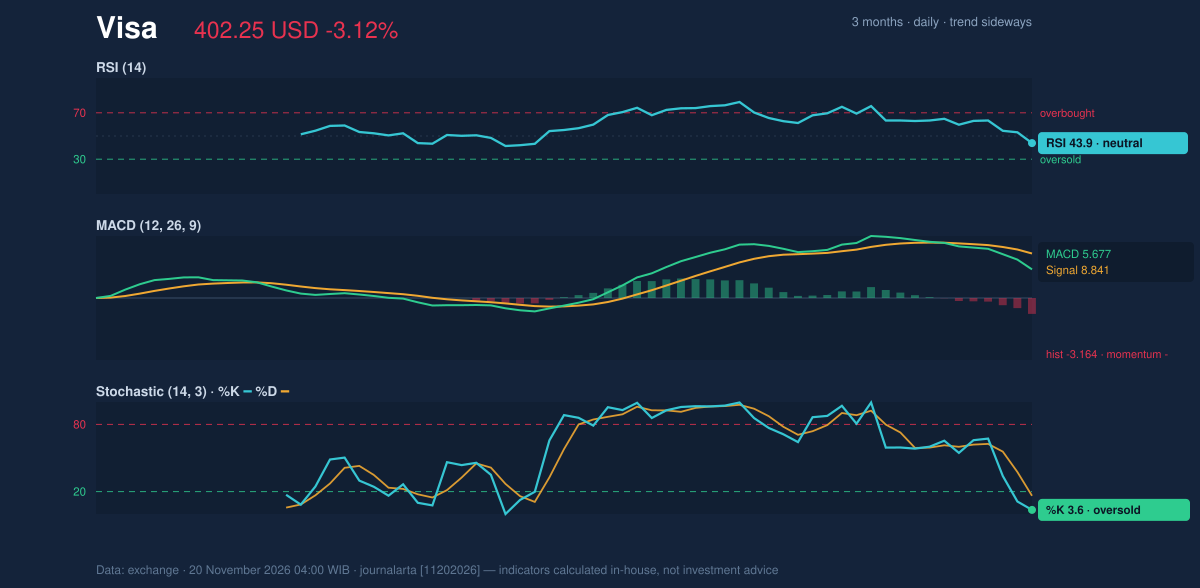
Volatility & Volume
Volatility is moderate, with the 14-day ATR at $10.44, or 2.6% of the last price. Bollinger bands are at normal width — 9.3% — so no squeeze is coiling for a breakout, and no expansion is underway to suggest a violent move is imminent. The %B reading of 11% places price near the lower band at $397.90, a zone that historically attracts buyers but only if volume supports it. Right now volume supports the sellers: heavier-than-average turnover paired with falling OBV suggests distribution rather than accumulation, which argues against treating the oversold Stochastic as an automatic buy signal.Key Levels & Scenarios
The map is clean. Immediate support sits at $400.60, the 20-day floor; a close below it would open the door to the $397.90 lower Bollinger band and, beyond that, the $386.59 level derived from 1.5× the ATR below the last price. On the upside, $436.57 is the 20-day resistance, with the three-month high of $442.23 as the next hurdle. A close above $436.57 would signal the pullback has run its course and put the uptrend back in charge. Until one of those levels breaks, the stock is boxed in, and the 5% cushion above support leaves limited room for error.Fundamental Context
The technicals are working against a fundamentally healthy backdrop. According to its SEC filing, Visa reported annual revenue of $45.90 billion for the fiscal year ended September 30, 2026, up 14.8% from $40.00 billion a year earlier, while net income rose to $23.50 billion from $20.06 billion. That earnings power underpins the pullback-to-support setup: the market is repricing the stock's near-term trajectory, not its business.Technical Verdict: HOLD (wait & see)
The research verdict is HOLD (wait & see), with a composite score of +46 on a −100 to +100 scale — below the +60 threshold for a buy and well above the −60 line for a sell. The call rests on three pillars: price remains above its 50-day average, the 20-day average sits above the 50-day, and only one bullish signal carries no offsetting bearish signal. Against that, the five-day 4.30% decline and negative MACD histogram argue for patience. The verdict is invalidated if price closes below the 20-day support at $400.60. - Entry Range: a confirmed close above the 20-day resistance of $436.57 - Exit Target: the three-month high of $442.23 - Stop Loss: a break of the 20-day support at $400.60, with the lower Bollinger band at $397.90 as the secondary line In plain terms: Visa's long-term trend is still standing, but its short-term engine is sputtering, so the smarter move is to wait for price to prove itself at one of the range edges rather than guess which way it breaks. "There's nothing broken in this chart — it's coiled, not collapsed," said a desk analyst tracking the stock, "but until it closes above that resistance, every bounce is just a head-fake."Summary Data Visa
| Last price | 402.25 USD |
| Change 1 day / 5 days / 1 month | -3.12% / -4.30% / -2.92% |
| Trend / MA-cross | sideways / none |
| SMA20 / SMA50 | 417.19 / 394.01 |
| RSI (14) / Stochastic %K | 43.9 / 3.6 |
| Bollinger %B / ATR | 11% / 10.44 |
| Support / Resistance 20 days | 400.60 / 436.57 |
| Data as of | 20 November 2026 04:00 WIB |
| JournalArta research verdict (score) | Hold (+46) |
Today's full Buy and Sell list for US stocks →
Disclaimer: This technical analysis is generated automatically from exchange data and indicators calculated by JournalArta, for information and education only. The verdict and the entry, target and stop-loss levels are not investment advice or a solicitation to buy or sell any security. Investment decisions and their risks rest solely with the reader.
Track Visa stock price daily: live levels, support/resistance and our full Visa analysis history.
 Take the quizWhat Kind of Holiday Spender Are You? Take the Black Friday QuizStart →





 Lifestyle · Food & HealthNormal Blood Pressure Chart by Age: Healthy Ranges Explained
 Lifestyle · Food & HealthWhat Is Raynaud’s Syndrome? Why Fingers Turn White in the Cold
 Lifestyle · Food & Health4 Ways Walking After Meals Helps Your Body, Doctors Say
 Lifestyle · Food & Health4 Reasons to Eat Oatmeal, According to Nutrition Experts