UnitedHealth (UNH) Stock Latest: Tumbles 5.55% on Thursday, Down 22.2% in a Month
Technical analysis of UNH stock on November 19, 2026: price 330.48 USD, trend sideways, RSI 24.3, support 330.48, resistance 418.09.
Why UNH is in focus today
- One-day move of 0.00%, about 0.0× its average daily range (ATR)
- Volume at 0.0× the 20-day average
Selected automatically from 11 NYSE (US) stocks by a technical-signal score with daily weighted randomisation — not a recommendation.
Trend & Price Action
The price structure has broken down cleanly. UnitedHealth trades below both its 20-day average of $398.43 and its 50-day average of $389.48, and the shorter average is now falling — down 2.21% over five days — which means the trend line is chasing the price lower rather than cushioning it. No new moving-average cross formed in the latest session; the bearish alignment was already in place. The Bollinger context is the sharpest signal. These bands plot two standard deviations around the 20-day average to show where price is statistically stretched. The lower band sits at $356.97, and the close at $330.48 puts the stock below it, with the band-width reading (a gauge of how far apart the upper and lower bands are) at 20.8% and widening. A close beneath the lower band after a period of compressed range is what technicians call a squeeze resolving to the downside — the market choosing direction, and choosing down.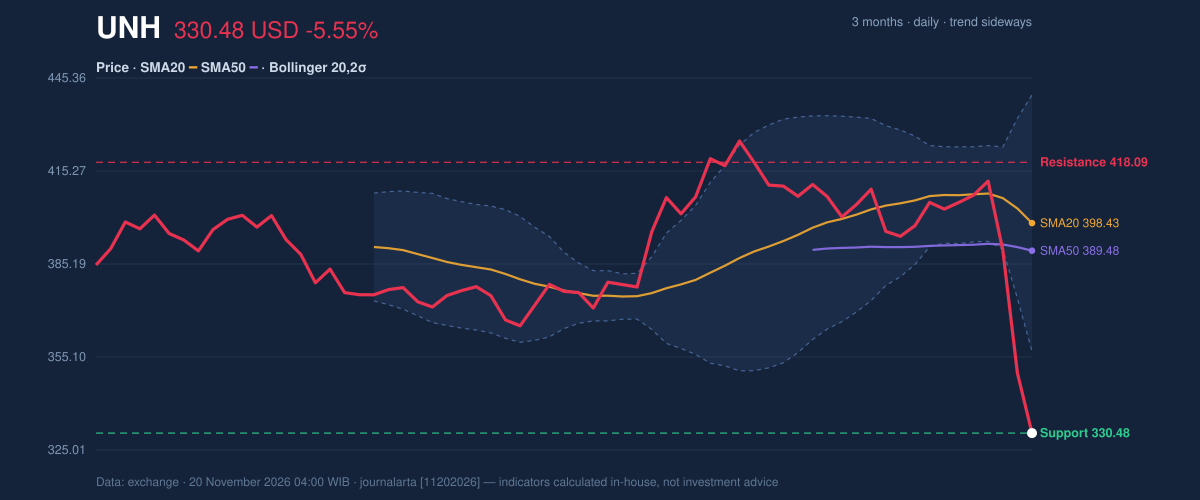
Oscillators & Momentum
Momentum is washed out but not yet turning. The 14-day RSI — a 0-to-100 speedometer where readings under 30 flag heavy selling — sits at 24.3, deep in oversold territory. Stochastic, which compares the close to the recent high-low range, is even more stretched at %K 6.4 against %D 8.4. Both say sellers have been aggressive and relentless. Oversold is not the same as a bottom. The MACD line, which tracks the gap between short and long moving averages, reads -7.390 against a signal line of 0.316, with the histogram at -7.706 — negative momentum that is still widening, not narrowing. The classic reversal signal requires the MACD line to curl back above its signal; it has not.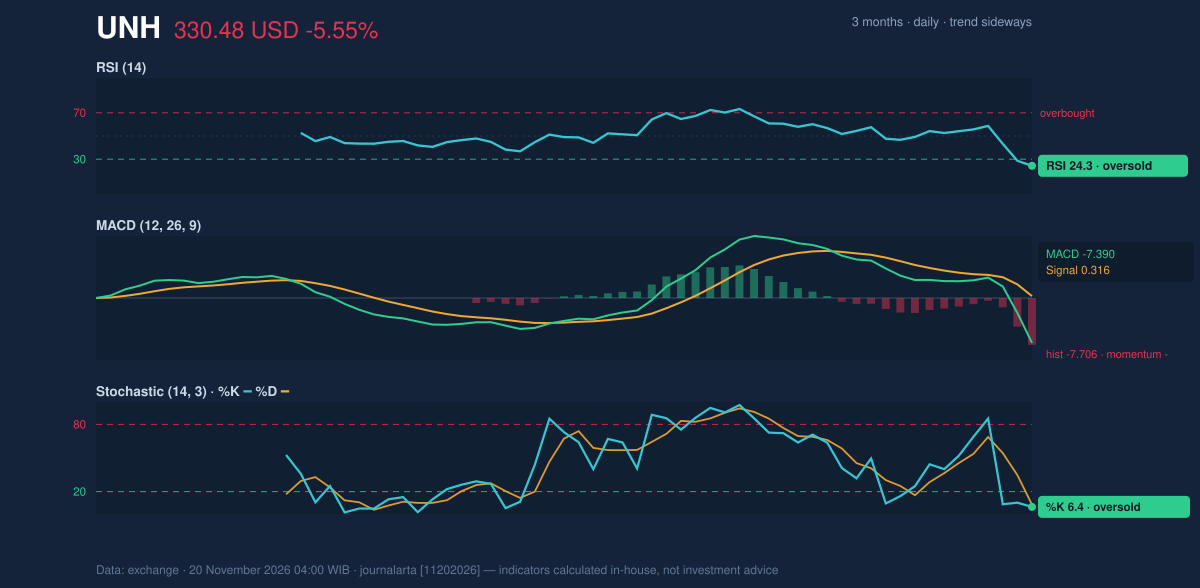
Volatility & Volume
The average true range — a measure of how much the stock moves in a typical session — is $15.94, or 4.8% of the share price. That is high volatility by any standard, and it explains why a single session can erase more than 5%. With the bands widening, the market is pricing a wider distribution of outcomes, not a calmer one. Position sizing, not conviction, is what this regime demands.Key Levels & Scenarios
The levels are unambiguous. Support rests at $330.48, with the three-month low of $324.67 just beneath. A decisive close below that floor would put the next reference at $306.57 — one and a half average ranges below the last price, a conventional stress-test marker. On the upside, resistance begins at $418.09, with the three-month high of $426.55 above it; a reclaim of that zone would require a move of more than 25% and is not a near-term scenario.Fundamental Context
The selloff arrives against a mixed earnings picture. UnitedHealth reported quarterly revenue of $112.69 billion for the quarter ended September 30, 2026, down 0.4% from $113.16 billion a year earlier, according to its SEC filing. Net income, however, rose to $4.11 billion from $2.35 billion, with diluted earnings per share of $4.56. The company also disclosed a change of directors or officers in a Form 8-K filed November 9. Revenue slipping while profit rises points to cost discipline — but the market is trading the top line and the leadership change, not the margin.Technical Verdict: HOLD (wait & see)
The signals do not align, and that is the case for patience rather than action. Three reasons anchor the call: price sits below both moving averages with the 20-day average still falling; the MACD histogram at -7.706 shows momentum still deteriorating; and volume ran 3.1× average on a down day, confirming real distribution rather than noise. The oversold RSI at 24.3 is a reason not to press a short, not a reason to buy. - Upside scenario: a close above the 20-day resistance at $418.09 would be the first evidence of a trend repair. - Downside scenario: a break of the 20-day support at $330.48 opens $324.67, then $306.57. - Invalidation: the hold verdict fails if price closes decisively below $330.48 on continued heavy volume. In plain terms: the stock is cheap by momentum measures but still falling under heavy volume, so the prudent stance is to wait for the selling to exhaust itself before drawing conclusions. *This is technical analysis based on exchange data, not investment advice.*Summary Data UNH
| Last price | 330.48 USD |
| Change 1 day / 5 days / 1 month | -5.55% / -18.43% / -22.24% |
| Trend / MA-cross | sideways / none |
| SMA20 / SMA50 | 398.43 / 389.48 |
| RSI (14) / Stochastic %K | 24.3 / 6.4 |
| Bollinger %B / ATR | -32% / 15.94 |
| Support / Resistance 20 days | 330.48 / 418.09 |
| Data as of | 20 November 2026 04:00 WIB |
| JournalArta research verdict (score) | Hold (-31) |
Today's full Buy and Sell list for US stocks →
Disclaimer: This technical analysis is generated automatically from exchange data and indicators calculated by JournalArta, for information and education only. The verdict and the entry, target and stop-loss levels are not investment advice or a solicitation to buy or sell any security. Investment decisions and their risks rest solely with the reader.
Track UNH stock price daily: live levels, support/resistance and our full UNH analysis history.
 Take the quizWhat Kind of Holiday Spender Are You? Take the Black Friday QuizStart →





 Lifestyle · Food & HealthNormal Blood Pressure Chart by Age: Healthy Ranges Explained
 Lifestyle · Food & HealthWhat Is Raynaud’s Syndrome? Why Fingers Turn White in the Cold
 Lifestyle · Food & Health4 Ways Walking After Meals Helps Your Body, Doctors Say
 Lifestyle · Food & Health4 Reasons to Eat Oatmeal, According to Nutrition Experts