UnitedHealth (UNH) Stock Update: Tumbles 5.42%, Trading Volume 1.6x Normal
Technical analysis of UNH stock on November 17, 2026: price 389.68 USD, trend sideways, RSI 43.0, support 389.68, resistance 424.98.

Why UNH is in focus today
- One-day move of 0.00%, about 0.0× its average daily range (ATR)
- Volume at 0.0× the 20-day average
Selected automatically from 2 NYSE (US) stocks by a technical-signal score with daily weighted randomisation — not a recommendation.
Trend & Price Action
The stock sits below both of its key moving averages. The 20-day average stands at $406.51 and the 50-day average at $391.50; price is beneath the faster average and essentially touching the slower one from below. No new moving-average cross has formed this session, so this is a continuation of a sideways structure rather than a fresh trend signal. The 20-day average itself edged down 0.16% over the past five sessions — the average is drifting lower, a sign the recent consolidation is leaning to the downside. Performance across windows confirms that tilt: -3.81% over five days and -7.06% over one month. The stock trades at 0% of its 20-day range — in plain terms, it is sitting on the floor of that range, with the 20-day support at $389.68 and resistance at $424.98. The three-month high of $426.55 is far above; the three-month low of $362.60 is the deeper line in the sand.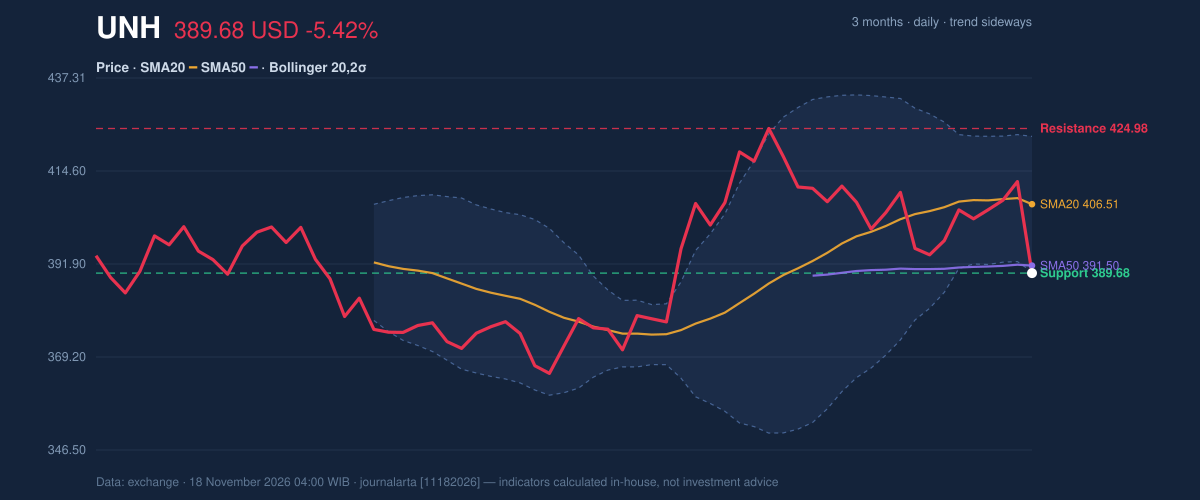
Oscillators & Momentum
Momentum is the weakest part of the picture. The MACD sits at 1.818 against a signal line of 3.319, with a histogram of -1.501 — the fast line has crossed beneath the slow line and the gap is widening, which is textbook negative momentum. The RSI at 43.0 is neutral but in the lower half of its range, leaning bearish without being washed out. The Stochastic tells a more extreme story: %K at 8.8 against %D at 54.3 places the fast line deep in oversold territory and far below the slow line. In plain language, the short-term selling has been fast and one-sided. That does not by itself signal a bounce — oversold readings can persist — but it flags that the immediate move is stretched.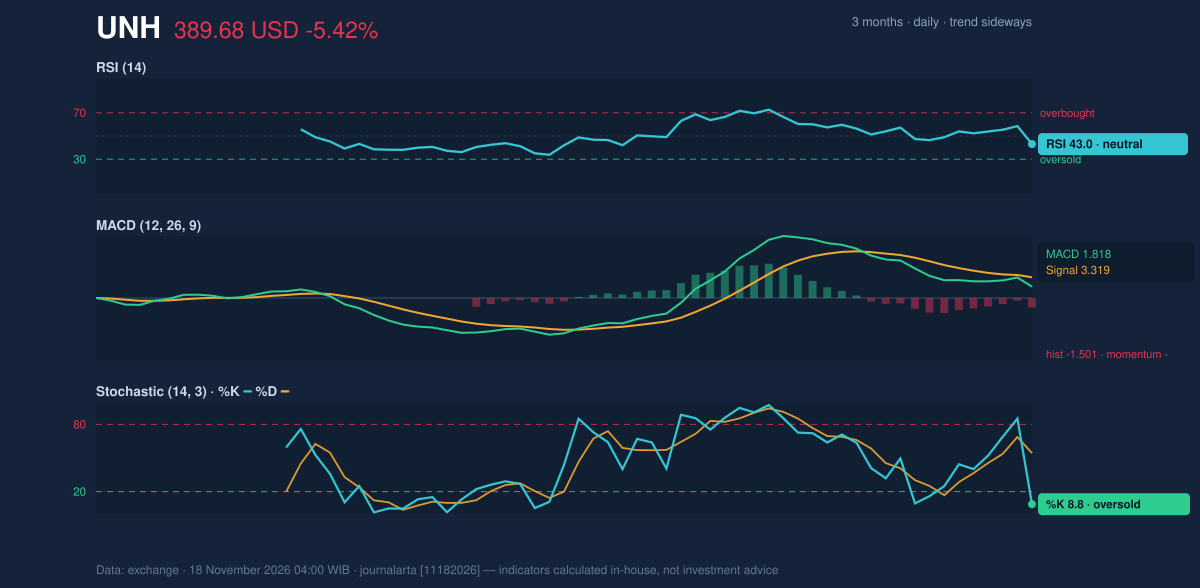
Volatility & Volume
The ATR of 11.96 equals 3.1% of the share price — moderate volatility. That matters for scenario planning: a normal day's range is roughly twelve dollars, so moves of that size should not be read as structural on their own. The 1.6× volume spike is the more telling figure. Heavy volume on a down day, pushing price through the lower Bollinger band, is the market voting with size.Fundamental Context
The filing backdrop is mixed. UnitedHealth reported quarterly revenue of $112.69 billion for the quarter ended September 30, 2026, down 0.4% from $113.16 billion a year earlier, according to its SEC filing. Net income, however, rose to $4.11 billion from $2.35 billion, with diluted earnings per share of $4.56. Separately, the company filed a Form 8-K on November 9 reporting a change of directors or officers — a governance event that can weigh on sentiment until investors see the substance behind it. The technical picture, not the earnings trend, is what drove the code-computed call below.Key Levels & Scenarios
The decisive line is the 20-day support at $389.68, where price closed. A clean break below it opens the path toward the three-month low of $362.60, with the 1.5×ATR downside reference at $371.74 sitting between them as a rough waypoint. On the upside, a close back above the 20-day resistance at $424.98 would be the first evidence that the sell-off has exhausted itself; the 20-day average at $406.51 and the 1.5×ATR upside reference at $407.62 form the nearer test of whether a bounce has legs. Until either boundary gives way, the range between support and resistance defines the battlefield.Technical Verdict: HOLD (wait & see)
The JournalArta research verdict is HOLD (wait & see), scoring -49 on a scale from -100 to +100, where +60 marks a buy zone and -60 a sell zone. Trend and momentum are not aligned yet, which is why the call sits in the middle rather than at either extreme. The three strongest reasons: first, price is below the 50-day average while the 20-day average remains above it — a configuration that argues rangebound chop, not a clean directional trend. Second, the RSI at 43.0 sits in the 30–50 zone, weak but not capitulating. Third, the volume signature — 1.6× average on a down day through the lower Bollinger band — says sellers are in control of the immediate tape. The verdict is invalidated on the downside if price breaks the 20-day support at $389.68, and on the upside if it closes above the 20-day resistance at $424.98. - Entry range (conditional, upside scenario): a confirmed close above $424.98 (20-day resistance), with the $426.55 three-month high as the immediate ceiling to clear. - Exit target: near the 3-month high of $426.55 on a breakout, or the 20-day average at $406.51 as first resistance on a bounce. - Stop loss: $389.68 (20-day support) for any long exposure; a break there shifts focus to $371.74 and then $362.60. In plain English: the stock is pinned at the bottom of its range with sellers holding the upper hand, so the disciplined stance is to wait for a break of either boundary rather than act inside the range. This is technical analysis, not an investment recommendation. | Indicator | Reading | Interpretation | |---|---|---| | Last price | $389.68 | At 0% of 20-day range | | 1-day / 5-day / 1-month | -5.42% / -3.81% / -7.06% | Weak across all windows | | SMA20 / SMA50 | $406.51 / $391.50 | Price below both | | Bollinger %B / width | -1% / 8.1% | Below lower band, normal width | | RSI(14) | 43.0 | Neutral, lower half | | Stochastic %K / %D | 8.8 / 54.3 | Oversold | | MACD / signal / histogram | 1.818 / 3.319 / -1.501 | Negative momentum | | ATR(14) | 11.96 (3.1%) | Moderate volatility | | Volume vs 20-day avg | 1.6× | Heavy selling | | Support / Resistance (20h) | $389.68 / $424.98 | Range boundaries | | 3-month high / low | $426.55 / $362.60 | Wider envelope | | Verdict | HOLD (wait & see) | Score -49 | The next scheduled catalyst is the company's next quarterly filing cycle; until then, watch whether the $389.68 support holds on a closing basis.Summary Data UNH
| Last price | 389.68 USD |
| Change 1 day / 5 days / 1 month | -5.42% / -3.81% / -7.06% |
| Trend / MA-cross | sideways / none |
| SMA20 / SMA50 | 406.51 / 391.50 |
| RSI (14) / Stochastic %K | 43.0 / 8.8 |
| Bollinger %B / ATR | -1% / 11.96 |
| Support / Resistance 20 days | 389.68 / 424.98 |
| Data as of | 18 November 2026 04:00 WIB |
| JournalArta research verdict (score) | Hold (-49) |
Today's full Buy and Sell list for US stocks →
Disclaimer: This technical analysis is generated automatically from exchange data and indicators calculated by JournalArta, for information and education only. The verdict and the entry, target and stop-loss levels are not investment advice or a solicitation to buy or sell any security. Investment decisions and their risks rest solely with the reader.
Track UNH stock price daily: live levels, support/resistance and our full UNH analysis history.
 Take the quizWhat Kind of Holiday Spender Are You? Take the Black Friday QuizStart →
- 1U.S. Emergency Alert Test Nov. 17 Is Not a Power Outage

- 2DUP Chairman Lord Morrow Loses Wife and Daughter Within Hours in NI

- 3NASA’s Curiosity Rover Burst Open a Rock and Found Pure Sulfur

- 4Women With Autoimmune Diseases Wait About 4 Years for Diagnosis, Study Finds

- 5Stock Market Today: Dow Futures Slip as Nasdaq Futures Climb Before Earnings

 Lifestyle · Food & Health4 Reasons to Eat Oatmeal, According to Nutrition Experts
 Lifestyle7 Signs Your Social Battery Is Running Low (and Why You Keep Cancelling Plans)
 Lifestyle · Food & HealthThanksgiving Food Safety: How Long Leftovers Last and the Safe Turkey Temperature
 Lifestyle7 Quiet Habits of Emotionally Intelligent People, According to Psychologists