Walt Disney (DIS) Stock Latest: Falls 1.48% on Tuesday, Trading Volume 2.3x Normal
Technical analysis of DIS stock on November 17, 2026: price 116.94 USD, trend uptrend, RSI 59.1, support 109.04, resistance 119.65.
By matthew jonathan
November 18, 2026·6 min read
Logo Walt Disney — JournalArta illustration
Why DIS is in focus today
Volume at 2.3× the 20-day average
Healthy pullback near SMA20 (115.00) within an uptrend
Selected automatically from 80 NYSE (US) stocks by a technical-signal score with daily weighted randomisation — not a recommendation.
Walt Disney shares fell 1.48% to $116.94 on Tuesday, November 17, 2026, but the more telling figure sat in the volume column: 20.3 million shares changed hands, 2.3 times the 20-day average. A down day on that much participation usually means holders were exiting in size — yet the stock is still sitting above both of its key moving averages and only 4.7% higher over the past month. That contradiction is the story.
The sell-off followed Disney's fiscal-year filing the same day, which showed revenue rising to $102.34 billion from $94.43 billion, according to its SEC filing, while net income slipped to $9.90 billion from $12.40 billion. More revenue, less profit — the market read that gap quickly.
Advertisement
Trend & Price Action
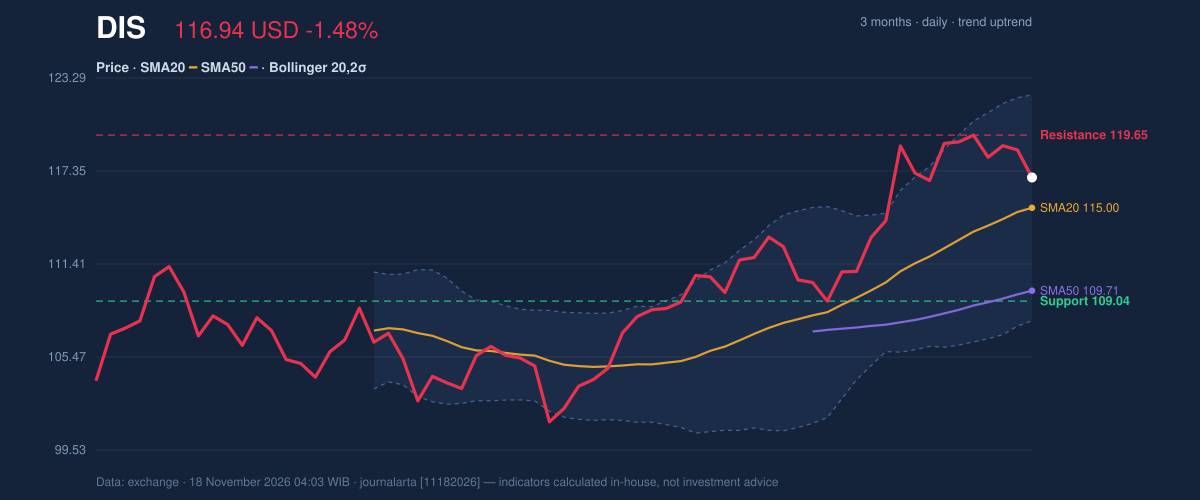
The structure underneath remains constructive. Disney closed at $116.94, above the 20-day average of $115.00 and well above the 50-day average of $109.71, and the 20-day average itself has been climbing, rising 1.81% over the past five days. That combination — price above a rising short-term average, which in turn sits above the longer-term one — is the textbook definition of an uptrend. No new moving-average cross has formed, so this is a trend already in place, not a fresh signal.
Where the stock sits inside its recent range matters just as much. The 20-day support rests at $109.04 and the 20-day resistance at $119.65, putting the price at roughly 74% of that band. The three-month high of $122.72 and low of $101.15 frame a stock that has spent most of the quarter climbing.
3-month price action chart of DIS: price, SMA20/50, Bollinger, support & resistance.
Advertisement
The pullback is therefore a retreat within an advance rather than a break of it. The five-day change of -1.90% is modest against the one-month gain of 4.72%, which tells you sellers have given back only a slice of what buyers built.
Oscillators & Momentum
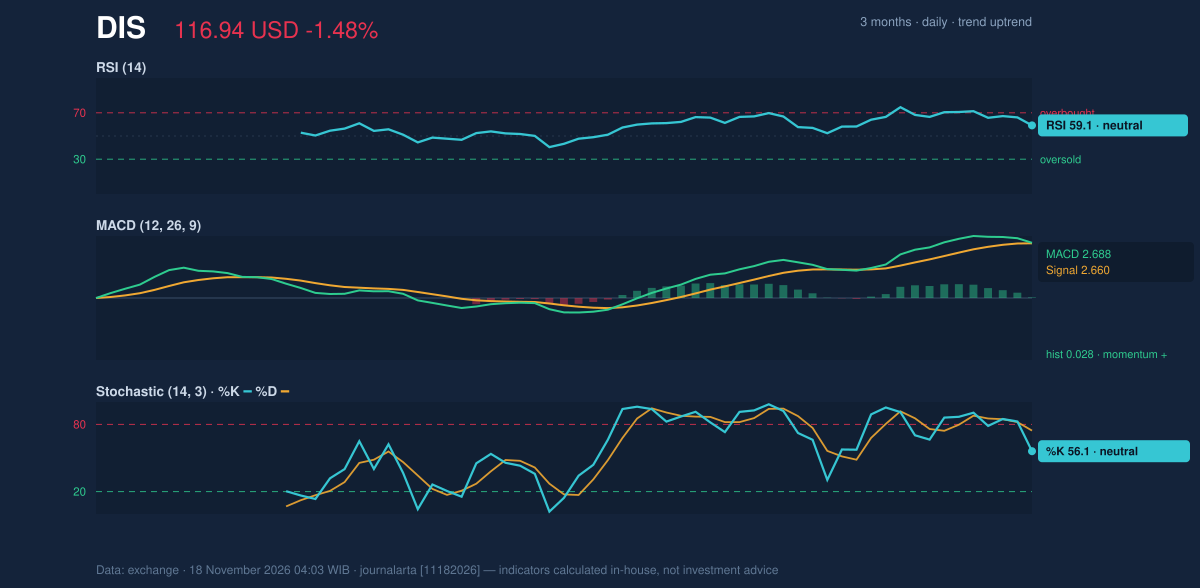
Momentum is the weak link. RSI(14) at 59.1 sits in neutral territory, but the pattern behind that number is what counts: the reading has rolled over from above 65. In plain terms, buying pressure peaked and has been easing — not collapsing, easing. Stochastic tells a similar story, with %K at 56.1 sitting below %D at 74.5, a configuration that typically signals short-term momentum turning down.
MACD is the exception. At 2.688 against a signal line of 2.660, the histogram reads a thin but positive 0.028 — momentum is still marginally up, though the margin is small enough that a single session could erase it.
Momentum chart of DIS: RSI(14), MACD, Stochastic.
Advertisement
So the picture is a trend that is intact and momentum that is fading. Those two forces are not yet pulling in the same direction, which is precisely why the setup reads as unresolved rather than decisive.
Volatility & Volume
Bollinger bands, which plot how far price typically strays from its average, are set at $122.21 on top and $107.79 at the bottom, a width of 12.5% that is normal for this stock. The %B reading of 63% places the price in the upper-middle of that channel — room to move either way, no squeeze forcing a breakout.
ATR(14) of 2.96, or 2.5% of the price, describes moderate daily swings. Put differently, a $3 move in either direction is ordinary noise here, not a signal in itself.
The volume is the harder puzzle. A 2.3-times spike on a red candle points to institutional-scale selling. But On-Balance Volume, which keeps a running tally of buying versus selling pressure, is falling — confirming that the heaviest flow was on the sell side. Heavy volume on a decline near support is a warning; the same volume absorbed near support would be the opposite. Which one this turns out to be depends on the next few sessions.
Advertisement
Key Levels & Scenarios
Two lines define the debate. On the upside, a close above $119.65 would clear the 20-day resistance and reopen the path toward the three-month high of $122.72; a decisive push beyond that would confirm the uptrend has resumed. On the downside, a break of $109.04 would put the 50-day average at $109.71 in play immediately, and losing that would undermine the entire structure. A volatility-based marker at $112.50 — one and a half average daily ranges below the close — offers an earlier warning line.
Until one of those breaks, the stock is boxed between support it has held and resistance it has not yet cleared.
Fundamental Context
The filing that triggered Tuesday's selling carried mixed numbers. Revenue of $102.34 billion marked an 8.4% increase, according to its SEC filing, a solid top line. Net income of $9.90 billion against $12.40 billion a year earlier, with diluted earnings per share of $5.63, shows margins under pressure even as sales grow. Disney also filed a Form 8-K the same day reporting a Regulation FD disclosure alongside its results of operations and financial condition — a reminder that management commentary, not just the arithmetic, is now part of the market's input.
Advertisement
Technical Verdict: HOLD (wait & see)
The evidence does not yet justify a directional call. Three reasons anchor that view:
- The trend is intact — price above both the 20-day average of $115.00 and the 50-day average of $109.71, with the shorter average rising — which rules out a bearish stance.
- Momentum is rolling over — RSI easing from above 65 and Stochastic %K below %D — which withholds bullish confirmation.
- Volume contradicts price — a 2.3-times spike on a down day with falling OBV suggests supply is being worked through, not exhausted.
The setup is invalidated upward if price closes decisively above $119.65, and invalidated downward if it breaks $109.04.
Conditional levels for planning, drawn strictly from the reference data:
- Upside entry scenario: a confirmed close above $119.65, with the next reference at the three-month high of $122.72 and a volatility-derived target near $121.38.
- Downside entry scenario: a break of $109.04, with the 50-day average at $109.71 as the first test and $112.50 as the prior warning line.
- Stop-loss discipline: a close beyond $112.50 on the downside or failure to hold $119.65 on the upside argues for standing aside rather than forcing a position.
In plain terms for non-traders: the company's long-term trend is still pointing up, but the recent selling has real weight behind it, so the sensible posture is to wait for the price to pick a side.
"It's the volume that bothers me," one desk analyst said Tuesday. "You don't get two-and-a-half times normal turnover on a down day and call it noise — you wait to see who's still standing at $109."
Disclaimer: This technical analysis is generated automatically from exchange data and indicators calculated by JournalArta, for information and education only. The verdict and the entry, target and stop-loss levels are not investment advice or a solicitation to buy or sell any security. Investment decisions and their risks rest solely with the reader.

 Take the quizWhat Kind of Holiday Spender Are You? Take the Black Friday QuizStart →





 Lifestyle · Food & Health4 Reasons to Eat Oatmeal, According to Nutrition Experts
 Lifestyle7 Signs Your Social Battery Is Running Low (and Why You Keep Cancelling Plans)
 Lifestyle · Food & HealthThanksgiving Food Safety: How Long Leftovers Last and the Safe Turkey Temperature
 Lifestyle7 Quiet Habits of Emotionally Intelligent People, According to Psychologists