PepsiCo (PEP) Stock Latest: Slides 3.01% on Tuesday, Down 1.1% in Five Sessions
Technical analysis of PEP stock on November 17, 2026: price 142.02 USD, trend uptrend, RSI 56.7, support 132.63, resistance 146.43.

Why PEP is in focus today
- One-day move of 0.00%, about 0.0× its average daily range (ATR)
Selected automatically from 4 NASDAQ (US) stocks by a technical-signal score with daily weighted randomisation — not a recommendation.
Trend & Price Action
The structural picture remains constructive. The price sits above its 20-day average of 139.59 and well above its 50-day average of 133.89, and the 20-day average itself has been rising, climbing 2.32% over the past five sessions. That slope is the key detail: a moving average that is still tilting upward suggests the short-term trend has not broken, only paused. No fresh moving-average cross has formed, so the longer-term alignment established earlier remains intact, with the 20-day average above the 50-day. Position within the range tells the same story. The stock is at 68% of its 20-day range, with support at 132.63 and resistance at 146.43, and it has traded between 123.47 and 148.25 over three months. A stock in the upper-middle of its range after a one-day slide is consolidating, not reversing.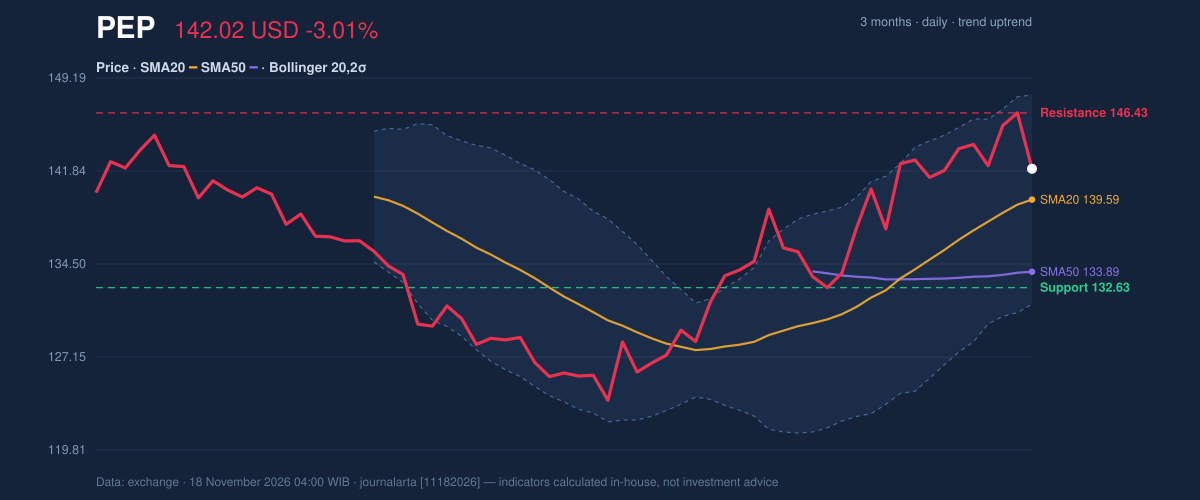
Oscillators & Momentum
Momentum is where the caution lives. The RSI(14) at 56.7 is neutral but has been rolling over from above 65 — a classic cooling pattern after strength, not a breakdown signal. The Stochastic tells a sharper story: %K at 59.9 against %D at 82.1, with the faster line dropping beneath the slower one, a short-term bearish crossover that often accompanies a pullback into support. The MACD remains positive at 3.162 versus a signal line of 2.830, with a histogram of 0.331. That is a modest but real bullish reading — momentum is decelerating, not flipping. The divergence between a softening RSI and a still-positive MACD is precisely what a healthy pullback inside an uptrend looks like.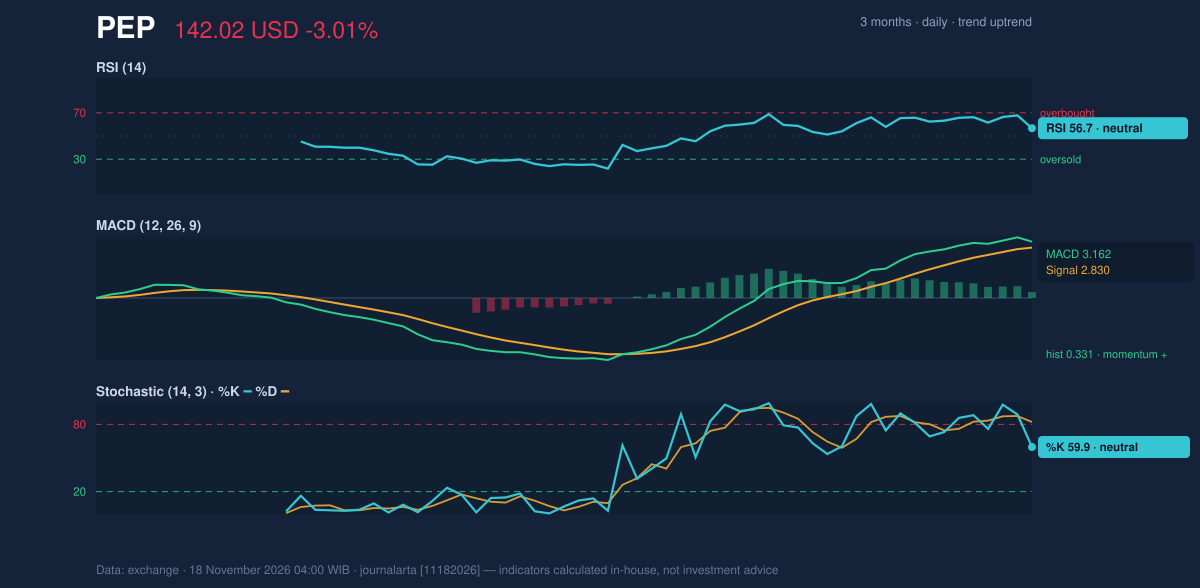
Volatility & Volume
Bollinger bands frame the risk. The 20-day bands run from 131.32 to 147.85, with the middle at 139.59, and the price sits at 65% of band width (%B). Band width of 11.8% is normal — neither a squeeze nor an expansion — meaning there is room for the stock to move without the volatility regime breaking. The ATR of 3.67, or 2.6% of price, points to moderate daily swings. Volume offers the most reassuring confirmation: OBV is rising despite the down day, a sign that accumulated buying pressure has not been unwound. When price dips but on-balance volume holds its ground, sellers are not in control.Key Levels & Scenarios
Two levels define the next move. If the stock reclaims 146.43, the 20-day resistance, it opens the path toward the three-month high of 148.25. If it fails to hold the 20-day average at 139.59, the next cushion is the 132.63 support, with the lower Bollinger band at 131.32 marking the outer risk boundary. Fundamentally, PepsiCo reported quarterly revenue of $25.27 billion for the quarter ended September 5, 2026, up 5.6% from $23.94 billion a year earlier, and net income of $3.05 billion with diluted earnings per share of $2.23, according to its SEC filing. Those numbers give the technical pullback a firmer floor.Technical Verdict: BUY
The verdict is driven by the alignment of trend and structure: the price holds above the 50-day average at 133.89, the 20-day average sits above the 50-day, the slope is rising, and RSI at 56.7 remains in the constructive 50–70 zone. OBV confirms the pullback is being absorbed. The chief risk is the RSI rolling over from above 65 and the Stochastic's %K/%D bearish cross — the verdict would be invalidated if price breaks below 135.76. - Entry Range: 139.27 – 142.02 - Exit Target 1: 151.41 - Exit Target 2: 160.80 - Stop Loss: 135.76 - Reward/Risk: 1.5 / 3.0 - Valid Until: December 16, 2026 In plain terms: the uptrend is intact, the dip looks like consolidation, and the stop sits just below the level where that view would stop being true. *This is technical analysis, not an investment recommendation.*Summary Data PEP
| Last price | 142.02 USD |
| Change 1 day / 5 days / 1 month | -3.01% / -1.11% / 5.97% |
| Trend / MA-cross | uptrend / none |
| SMA20 / SMA50 | 139.59 / 133.89 |
| RSI (14) / Stochastic %K | 56.7 / 59.9 |
| Bollinger %B / ATR | 65% / 3.67 |
| Support / Resistance 20 days | 132.63 / 146.43 |
| Data as of | 18 November 2026 04:00 WIB |
| JournalArta research verdict (score) | Buy (+66) |
| Entry zone | 139.27 – 142.02 |
| Target 1 / 2 | 151.41 / 160.80 |
| Stop loss | 135.76 |
| Reward/risk | 1.5 / 3.0 |
Disclaimer: This technical analysis is generated automatically from exchange data and indicators calculated by JournalArta, for information and education only. The verdict and the entry, target and stop-loss levels are not investment advice or a solicitation to buy or sell any security. Investment decisions and their risks rest solely with the reader.
Track PEP stock price daily: live levels, support/resistance and our full PEP analysis history.
 Take the quizWhat Kind of Holiday Spender Are You? Take the Black Friday QuizStart →
Most Read
- 1U.S. Emergency Alert Test Nov. 17 Is Not a Power Outage

- 2DUP Chairman Lord Morrow Loses Wife and Daughter Within Hours in NI

- 3NASA’s Curiosity Rover Burst Open a Rock and Found Pure Sulfur

- 4Women With Autoimmune Diseases Wait About 4 Years for Diagnosis, Study Finds

- 5Stock Market Today: Dow Futures Slip as Nasdaq Futures Climb Before Earnings

Don't Miss
 Lifestyle · Food & Health4 Reasons to Eat Oatmeal, According to Nutrition Experts
 Lifestyle7 Signs Your Social Battery Is Running Low (and Why You Keep Cancelling Plans)
 Lifestyle · Food & HealthThanksgiving Food Safety: How Long Leftovers Last and the Safe Turkey Temperature
 Lifestyle7 Quiet Habits of Emotionally Intelligent People, According to Psychologists