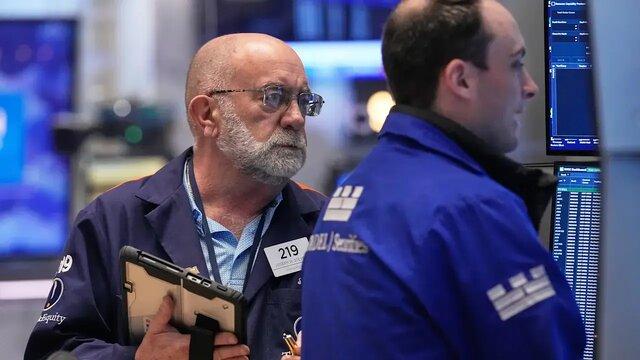
Blackstone (BX) Stock Falls 0.45% (November 17, 2026): Down 4.9% in Five Sessions
Technical analysis of BX stock on November 17, 2026: price 116.48 USD, trend sideways, RSI 46.5, support 109.57, resistance 125.57.

Why BX is in focus today
- Fresh golden cross: SMA20 crossed above SMA50
- MACD histogram has just turned negative
Selected automatically from 80 NYSE (US) stocks by a technical-signal score with daily weighted randomisation — not a recommendation.
Trend & Price Action
Position within the range frames the risk. Blackstone sits at roughly 43% of the 20-day range between support at 109.57 and resistance at 125.57, with a three-month high of 146.87 and low of 105.44. That midpoint placement matters: the stock has room to fall before testing support and room to rise before hitting resistance, but it holds no structural advantage either way. The golden cross argues the medium-term trend is trying to turn up; the price below the 20-day average argues the turn is not yet confirmed by actual trading.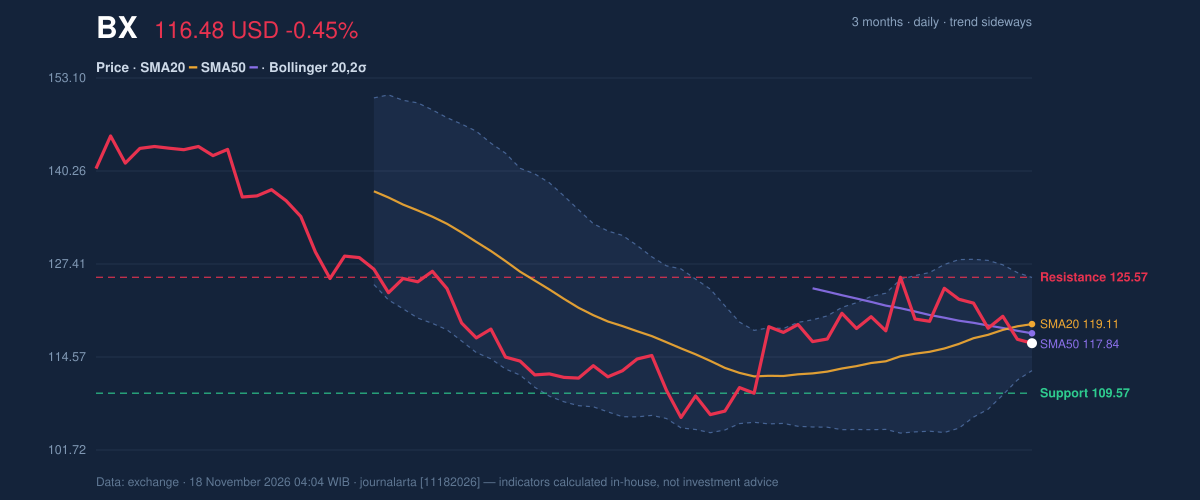
Oscillators & Momentum
Momentum is where the bullish case breaks down. The MACD histogram has just turned negative, with the MACD line at 0.429 against a signal line of 0.610 and a histogram of −0.181. The MACD line remains positive in absolute terms, but it has dropped below its signal — the classic short-term deterioration that precedes a broader momentum shift. This is the direct counterweight to the golden cross: the longer averages are improving while the faster oscillator is fading.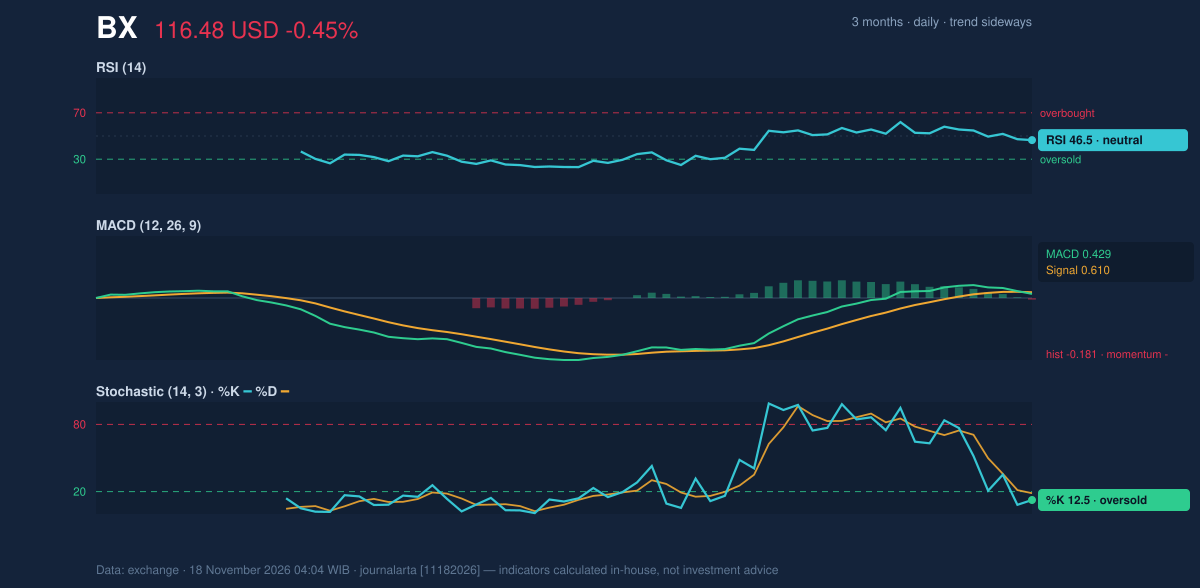
Volatility & Volume
Volatility is elevated. The ATR of 4.24 equals 3.6% of the price, meaning daily swings of that magnitude are normal for this stock. Translate that to levels: one-and-a-half ATR below the close is 110.11, and the same distance above is 122.85. Those brackets define where a routine session could reach without anything unusual happening, and they sit comfortably inside the wider support and resistance bands. Volume is the weakest link. The latest session traded 3.23 million shares against a 20-day average of 5.38 million — roughly 0.6 times normal — and OBV is declining. Thin volume on a pullback is not panic, but declining on-balance volume says sellers, not buyers, are in control of the tape. A golden cross built on light participation deserves skepticism.Fundamental Context
The operating backdrop offers no immediate catalyst either way. According to its SEC filing, Blackstone reported quarterly revenue of $3.06 billion for the quarter ended September 30, 2026, down 0.8% from $3.09 billion a year earlier. Net income rose to $662.4 million from $624.9 million, with diluted earnings per share of $0.83. Flat-to-lower revenue with higher profit is a margin story, not a growth story — consistent with a stock that is consolidating rather than breaking out.Technical Verdict: HOLD (wait & see)
The signal set is genuinely split, which is why the verdict is neither directional nor urgent. The drivers: price sits below its 50-day average, the 20-day average is above the 50-day, RSI at 46.5 is in the 30-to-50 zone, and the five-day move is a 4.94% drop. Against that, a fresh golden cross is on the board. - Upside scenario: a close above the 20-day resistance at 125.57 would validate the golden cross and open the path toward the three-month high at 146.87. Entry consideration on confirmation near 125.57, with a target at 146.87 and protection below the 20-day average at 119.11. - Downside scenario: a break of the 20-day support at 109.57 would invalidate the constructive setup. That level sits just above the 1.5×ATR floor of 110.11, making it the line to watch; a failure there exposes the three-month low at 105.44. - Stop protection: the verdict is invalidated if price breaks below 109.57 on expanding volume. For a general reader: this is a stock in a tug-of-war between improving medium-term averages and fading short-term momentum, and the honest answer is to wait for one side to win. "The golden cross is the market's polite way of saying the trend might be turning," one desk strategist said. "But polite doesn't pay — until volume shows up, it's just a line on a chart."Summary Data BX
| Last price | 116.48 USD |
| Change 1 day / 5 days / 1 month | -0.45% / -4.94% / 5.56% |
| Trend / MA-cross | sideways / golden |
| SMA20 / SMA50 | 119.11 / 117.84 |
| RSI (14) / Stochastic %K | 46.5 / 12.5 |
| Bollinger %B / ATR | 30% / 4.24 |
| Support / Resistance 20 days | 109.57 / 125.57 |
| Data as of | 18 November 2026 04:04 WIB |
| JournalArta research verdict (score) | Hold (-20) |
Today's full Buy and Sell list for US stocks →
Disclaimer: This technical analysis is generated automatically from exchange data and indicators calculated by JournalArta, for information and education only. The verdict and the entry, target and stop-loss levels are not investment advice or a solicitation to buy or sell any security. Investment decisions and their risks rest solely with the reader.
Track BX stock price daily: live levels, support/resistance and our full BX analysis history.
 Take the quizWhat Kind of Holiday Spender Are You? Take the Black Friday QuizStart →
- 1U.S. Emergency Alert Test Nov. 17 Is Not a Power Outage

- 2DUP Chairman Lord Morrow Loses Wife and Daughter Within Hours in NI

- 3NASA’s Curiosity Rover Burst Open a Rock and Found Pure Sulfur

- 4Women With Autoimmune Diseases Wait About 4 Years for Diagnosis, Study Finds

- 5Stock Market Today: Dow Futures Slip as Nasdaq Futures Climb Before Earnings

 Lifestyle · Food & Health4 Reasons to Eat Oatmeal, According to Nutrition Experts
 Lifestyle7 Signs Your Social Battery Is Running Low (and Why You Keep Cancelling Plans)
 Lifestyle · Food & HealthThanksgiving Food Safety: How Long Leftovers Last and the Safe Turkey Temperature
 Lifestyle7 Quiet Habits of Emotionally Intelligent People, According to Psychologists