Boeing (BA) Stock Update: Falls 0.79%, Down 13.9% in a Month
Technical analysis of BA stock on November 17, 2026: price 163.91 USD, trend downtrend, RSI 30.5, support 163.91, resistance 192.28.

Why BA is in focus today
- Closed at a 20-day low (163.91)
- Trading near its 3-month low (163.30)
- MACD histogram has just turned negative
- Downtrend extending (5-day change -5.46%)
- Not covered by JournalArta in the last 14 days
Selected automatically from 80 NYSE (US) stocks by a technical-signal score with daily weighted randomisation — not a recommendation.
Trend & Price Action
As shown in the chart, price is hugging the lower Bollinger band at $159.48, with the 20-day basis line at $175.00 and the upper band at $190.53. The band width of 17.7% is normal — not a squeeze — which means the downtrend has room to extend without a volatility contraction forcing a snapback. The %B reading of 14% says the stock is pressed near the bottom of the envelope but has not yet broken cleanly beneath it.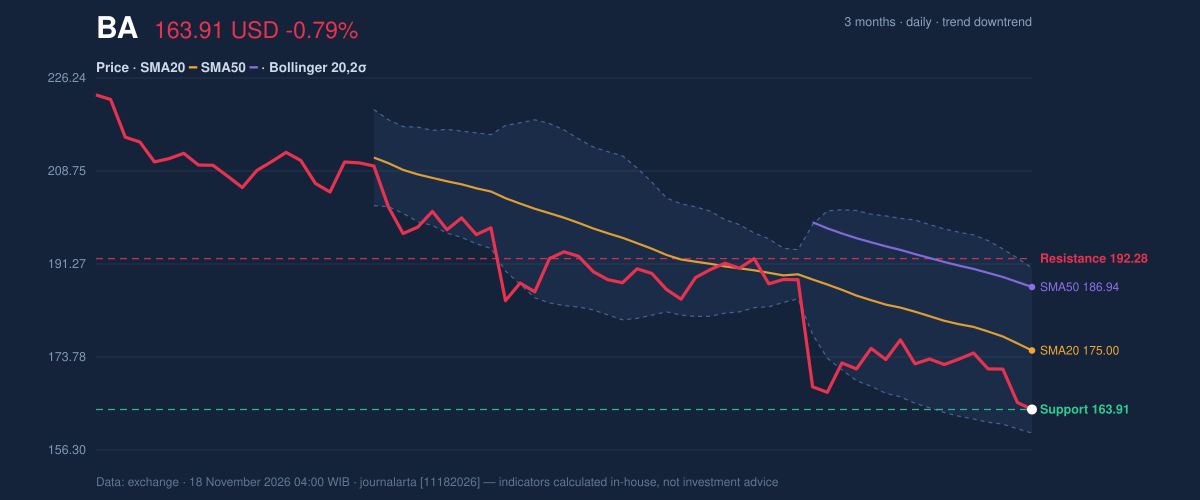
Oscillators & Momentum
The momentum picture is one of exhaustion without a trigger. RSI(14) at 30.5 is officially neutral by the data's classification, but it sits on the threshold of oversold territory. Stochastic %K has collapsed to 3.8 against %D at 11.9 — deeply oversold, and the kind of reading that often precedes a technical bounce but does not, by itself, end a downtrend.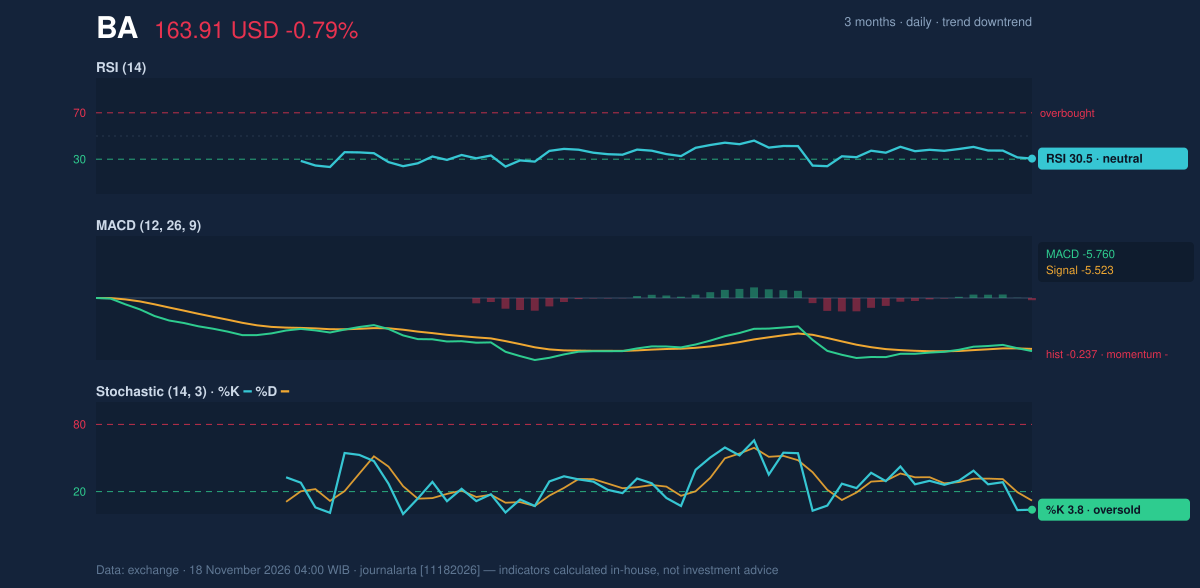
Volatility & Volume
ATR(14) at 5.07 represents 3.1% of the price — moderate volatility, not a panic regime. Combined with the normal-width Bollinger bands, the stock is moving lower in an orderly fashion rather than crashing. But order cuts both ways: orderly declines can persist. Volume tells the more telling story. The latest session traded 5,563,600 shares — 0.5× the 20-day average of 10,531,710. Thin volume on a new low means sellers are not being met by aggressive buyers; there is little conviction on either side, and On-Balance Volume is falling. Weakening OBV is the second bearish signal: distribution continues even as participation thins.Fundamental Context
The technical weakness is not mirrored in the most recent filing. Boeing reported quarterly revenue of $24.19 billion for the quarter ended September 30, 2026, up 3.9% from $23.27 billion a year earlier, and narrowed its net loss to $116.0 million from $5.34 billion, with diluted EPS of -$0.26, according to its SEC filing. The turnaround in the income statement is real — but the market is pricing the stock on something else, and the chart says so louder than the filing does.Key Levels & Scenarios
Support rests at $163.91, with the three-month low at $163.30 just beneath. Resistance is at $192.28 on the 20-day measure, though the 20-day average at $175.00 is the nearer hurdle any recovery must clear. If price breaks below $163.30, the decline extends into territory without a recent anchor. If it holds and reclaims $175.00, the downtrend structure would need re-examination — but that level is 6.8% above Tuesday's close.Technical Verdict: SELL
SELL — the data's research score is -76 on a -100 to +100 scale, with zero bullish against two bearish technical signals. Three reasons stand out: price is below both the 20-day ($175.00) and 50-day ($186.94) averages; the 20-day average has fallen below the 50-day; and the MACD histogram has just flipped negative at -0.237. The verdict is invalidated if price breaks above the stop at $172.53. - Sell zone: $163.91 – $167.70 - Exit/Target 1: $150.98 - Exit/Target 2: $138.05 - Stop Loss: $172.53 - Reward/risk: 1.5 to 3.0 - Valid until: December 16, 2026 In plain terms: the trend, the momentum and the volume all point the same way, and the data's model calls for caution rather than a bet on a bounce. *This is technical analysis based on exchange data, not investment advice.*Summary Data BA
| Last price | 163.91 USD |
| Change 1 day / 5 days / 1 month | -0.79% / -5.46% / -13.94% |
| Trend / MA-cross | downtrend / none |
| SMA20 / SMA50 | 175.00 / 186.94 |
| RSI (14) / Stochastic %K | 30.5 / 3.8 |
| Bollinger %B / ATR | 14% / 5.07 |
| Support / Resistance 20 days | 163.91 / 192.28 |
| Data as of | 18 November 2026 04:00 WIB |
| JournalArta research verdict (score) | Sell (-76) |
| Sell zone | 163.91 – 167.70 |
| Target 1 / 2 | 150.98 / 138.05 |
| Stop loss | 172.53 |
| Reward/risk | 1.5 / 3.0 |
Today's full Buy and Sell list for US stocks →
Disclaimer: This technical analysis is generated automatically from exchange data and indicators calculated by JournalArta, for information and education only. The verdict and the entry, target and stop-loss levels are not investment advice or a solicitation to buy or sell any security. Investment decisions and their risks rest solely with the reader.
Track BA stock price daily: live levels, support/resistance and our full BA analysis history.
 Take the quizWhat Kind of Holiday Spender Are You? Take the Black Friday QuizStart →
- 1U.S. Emergency Alert Test Nov. 17 Is Not a Power Outage

- 2DUP Chairman Lord Morrow Loses Wife and Daughter Within Hours in NI

- 3NASA’s Curiosity Rover Burst Open a Rock and Found Pure Sulfur

- 4Women With Autoimmune Diseases Wait About 4 Years for Diagnosis, Study Finds

- 5Stock Market Today: Dow Futures Slip as Nasdaq Futures Climb Before Earnings

 Lifestyle · Food & Health4 Reasons to Eat Oatmeal, According to Nutrition Experts
 Lifestyle7 Signs Your Social Battery Is Running Low (and Why You Keep Cancelling Plans)
 Lifestyle · Food & HealthThanksgiving Food Safety: How Long Leftovers Last and the Safe Turkey Temperature
 Lifestyle7 Quiet Habits of Emotionally Intelligent People, According to Psychologists