Goldman Sachs (GS) Stock Falls 1.57%: Down 3.6% in Five Sessions
Technical analysis of GS stock on November 17, 2026: price 877.52 USD, trend sideways, RSI 43.3, support 865.82, resistance 928.00.
By Alistair Sterling
November 18, 2026·5 min read
Logo Goldman Sachs — JournalArta illustration
Goldman Sachs shares closed at $877.52 on the New York Stock Exchange on Tuesday, November 17, 2026, down 1.57% for the session and 3.59% over the past five trading days, according to exchange data. The move leaves the bank trading below both its 20-day and 50-day moving averages — a positioning that matters more than the headline decline itself.
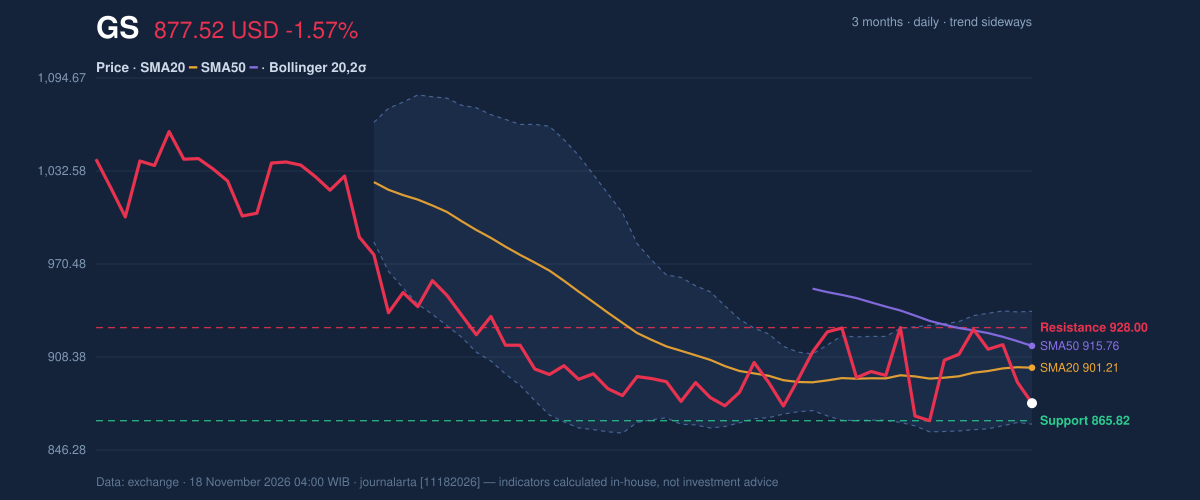
The stock sits 19% into its 20-day range, with support at $865.82 and resistance at $928.00. That low reading tells you buyers have not defended the upper half of the range for some time.
Trend & Price Action
The structural picture is one of drift, not collapse. The 20-day average sits at $901.21 and the 50-day at $915.76, both above the last price, and the 20-day average has risen just 0.64% over five sessions — technically rising, but barely. There is no fresh moving-average cross to report, which means the market is working through an established mild downtrend rather than reacting to a new technical event.
What stands out is where the stock sits relative to its three-month extremes. The high of $1,063.52 and low of $854.45 frame a wide $209 band, and Goldman is trading in the lower fifth of it. That is not a breakdown — the low has held — but it is a market that has stopped paying up for the shares.
3-month price action chart of GS: price, SMA20/50, Bollinger, support & resistance.
Advertisement
The Bollinger setup reinforces the point without adding drama. The bands run from $863.51 to $938.91, giving a normal 8.4% width, and the %B reading of 19% puts price close to the lower band. In plain terms, Goldman is cheap relative to its own recent range but is not yet at a level where the band itself forces a bounce.
Oscillators & Momentum
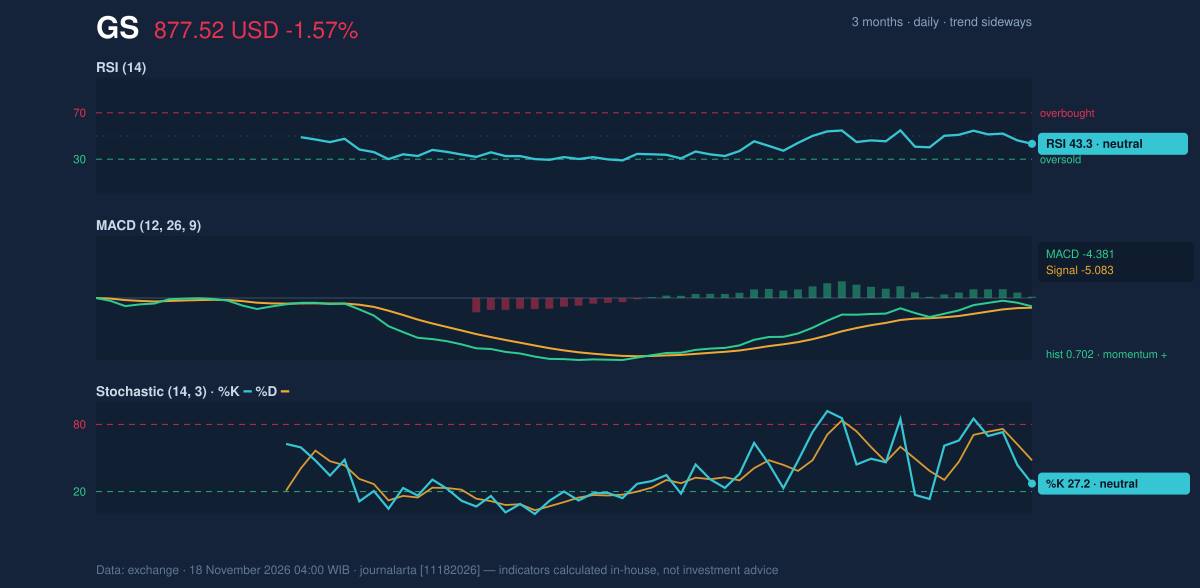
Momentum is mixed in a way that argues for patience. The RSI(14) at 43.3 is neutral but sits in the weaker 30–50 zone — enough selling pressure to keep the trend tilted down, not enough to signal capitulation.
The MACD offers the one constructive note. At -4.381 against a signal line of -5.083, the histogram is positive at 0.702, meaning the downside momentum is decelerating even as the indicator remains below zero. A narrowing gap is not a reversal; it is the market catching its breath.
Momentum chart of GS: RSI(14), MACD, Stochastic.
Advertisement
The stochastic is the most cautious signal: %K at 27.2 has fallen well below %D at 48.0, a setup that typically precedes further weakness rather than a turn higher. Short-term traders are selling into the move, and the oscillator has not yet reached the oversold threshold where buyers historically step in.
Volatility & Volume
The ATR(14) of 30.50 equals 3.5% of the price — moderate volatility for a large-cap financial. That matters for levels: a single session can move Goldman roughly $30 without anything unusual happening, so the gap between the last price and the $865.82 support is less than one average day's range.
Volume tells the more telling story. Tuesday's 1,807,100 shares came in at 0.9× the 20-day average of 2,123,735, and On-Balance Volume is falling. Thin participation on a decline is ambiguous — it can mean conviction is absent on the sell side — but falling OBV confirms that the marginal flow has been distribution, not accumulation.
Advertisement
Fundamental Context
The technical softness sits against strong reported results. Goldman Sachs reported quarterly revenue of $18.68 billion for the quarter ended September 30, 2026, up 23.0% from $15.18 billion a year earlier, and net income of $5.29 billion versus $4.10 billion, with diluted earnings per share of $17.01, according to its SEC filing dated November 2. Earnings strength and a sagging share price are not contradictory — they usually mean expectations were already high.
Compounding the Picture
No single indicator here is extreme. The problem is alignment — or the lack of it.
Key Levels & Scenarios
The reference levels are clear. On the upside, a close above the $928.00 20-day resistance would put price back above the 20-day and 50-day averages and reopen the path toward the three-month high of $1,063.52. On the downside, a break of $865.82 support exposes the three-month low at $854.45, with the price minus 1.5×ATR level of $831.78 marking the outer edge of a stress move.
Advertisement
Technical Verdict: HOLD (wait & see)
The call is HOLD (wait & see), mirroring the JournalArta research score of -50 on its -100 to +100 scale — below the +60 buy threshold and above the -60 sell threshold. Three reasons carry the decision:
- Price is below its 50-day average and the 20-day average sits below the 50-day, keeping the trend structure negative.
- RSI at 43.3 is stuck in the 30–50 zone with no oversold trigger, and stochastic %K has separated bearishly from %D.
- The five-day decline of 3.59% has not been met with volume expansion or a support test, meaning the move lacks a resolution point.
Conditional levels, not forecasts:
- Upside trigger: a close above the $928.00 resistance, which would align price with the moving averages and the positive MACD histogram.
- Exit target on that scenario: $1,063.52, the three-month high.
- Downside scenario: a break of $865.82 support, with $854.45 as the next reference and $831.78 as the outer guard.
- Stop protection: $854.45 for long exposure, or $865.82 for tighter risk control.
- Verdict invalidated if price breaks decisively above $928.00 or below $854.45.
In plain English: Goldman's business is performing, but the share price has lost its footing and neither the trend nor the momentum indicators are yet pointing the same way — so the sensible technical stance is to wait for a level to break rather than act in between.
Disclaimer: This technical analysis is generated automatically from exchange data and indicators calculated by JournalArta, for information and education only. The verdict and the entry, target and stop-loss levels are not investment advice or a solicitation to buy or sell any security. Investment decisions and their risks rest solely with the reader.

 Take the quizWhat Kind of Holiday Spender Are You? Take the Black Friday QuizStart →





 Lifestyle · Food & Health4 Reasons to Eat Oatmeal, According to Nutrition Experts
 Lifestyle7 Signs Your Social Battery Is Running Low (and Why You Keep Cancelling Plans)
 Lifestyle · Food & HealthThanksgiving Food Safety: How Long Leftovers Last and the Safe Turkey Temperature
 Lifestyle7 Quiet Habits of Emotionally Intelligent People, According to Psychologists