Oracle (ORCL) Stock Slides 3.43% (November 17, 2026): Down 12.3% in a Month
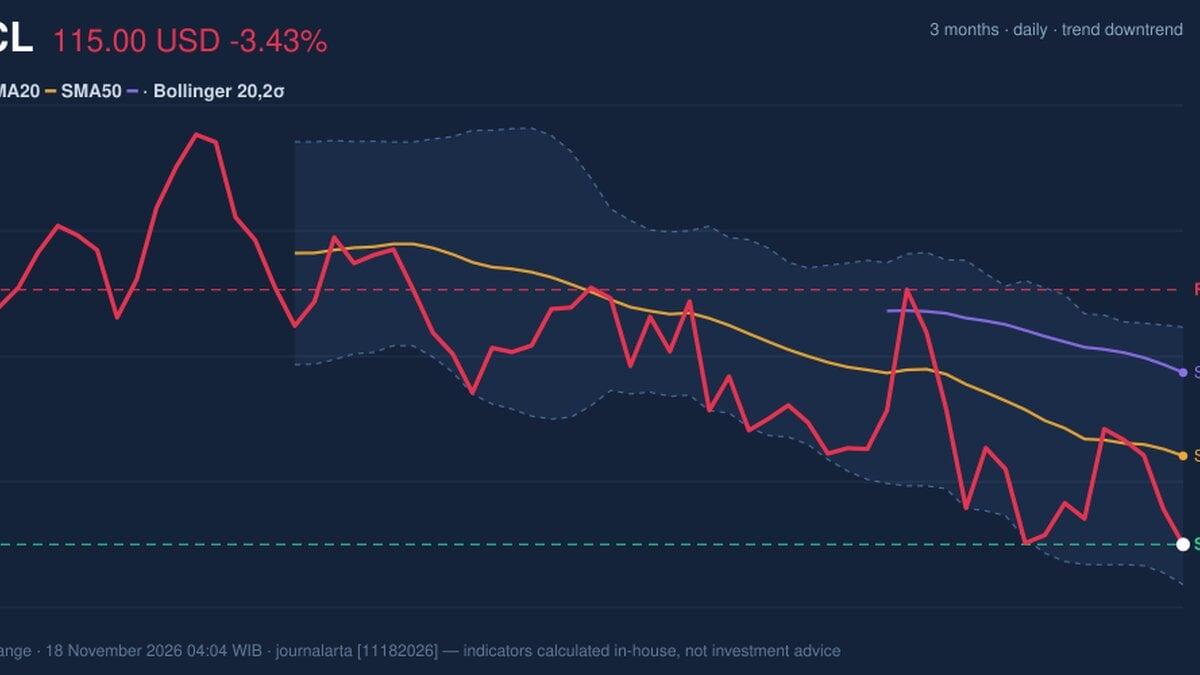
Technical analysis of ORCL stock on November 17, 2026: price 115.00 USD, trend downtrend, RSI 40.0, support 115.00, resistance 144.54.
Why ORCL is in focus today
- Closed at a 20-day low (115.00)
- MACD histogram has just turned negative
- Downtrend extending (5-day change -2.53%)
Selected automatically from 80 NYSE (US) stocks by a technical-signal score with daily weighted randomisation — not a recommendation.
Trend & Price Action
The structure is unambiguous. Oracle trades well below its 20-day moving average of $125.26 and further below its 50-day average of $134.92. There is no fresh moving-average cross — no golden or death cross to mark — but the arrangement itself is the message: the shorter average sits beneath the longer one, and on Tuesday the 20-day line fell 1.53% over five sessions. A falling short-term average inside a longer-term downtrend is the textbook definition of a stock still searching for a floor.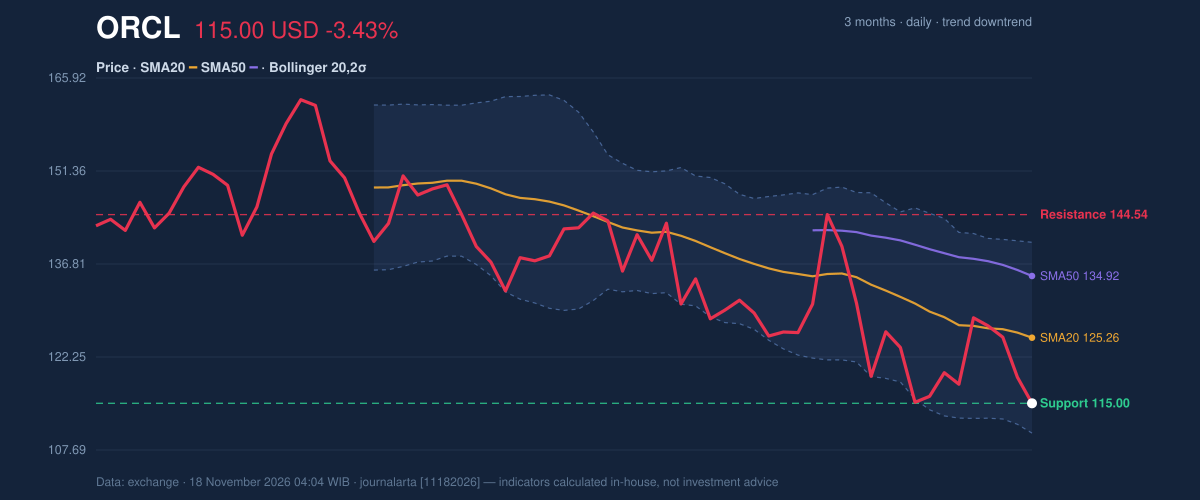
Oscillators & Momentum
Momentum is weak but not yet panicked — a distinction that matters. The 14-day RSI reads 40.0, technically neutral but drifting into the lower half of its range, which tells you selling is steady rather than climactic. Stochastic tells a sharper story: %K at 16.4 against %D at 27.5 puts the fast line deep in oversold territory, an early warning that a short-term bounce is possible even inside a downtrend. MACD refuses to endorse that hope. At -4.296 against a signal line of -4.170, the histogram sits at -0.126 and has only just turned negative — a fresh bearish tilt rather than an old, exhausted one.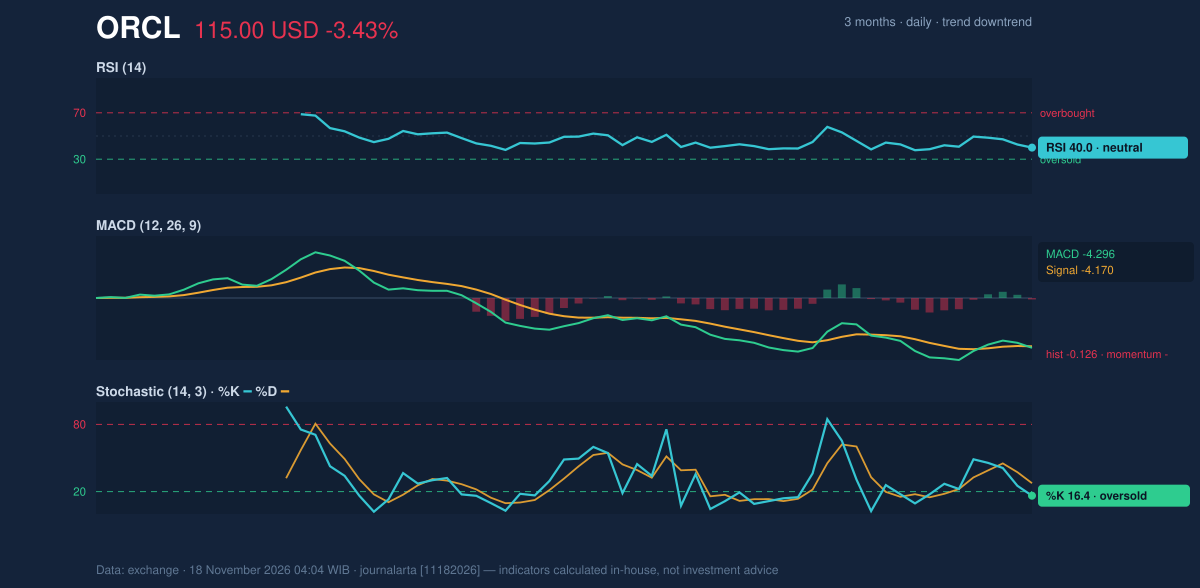
Volatility, Volume & Fundamentals
Volatility is wide and getting wider. The average true range is $8.64, or 7.5% of the price — a full day’s swing that demands respect from anyone sizing a position. The Bollinger bands are spread 23.8% apart and expanding, with %B at 16% — the price hugging the lower band at $110.33. Expanding bands plus a low %B means the market is paying up for movement, and the direction so far has been down. Volume complicates the picture. Tuesday’s 25.6 million shares came in at just 0.6× the 20-day average of 41.7 million — thin participation, and alongside a falling OBV, a sign that sellers are persistent but not yet in a rush to exit. For a global reader: thin volume on a breakdown can mean the floor is soft, not that it is safe. Fundamentally, the filings offer a contrast worth noting. Oracle reported quarterly revenue of $19.35 billion for the quarter ended August 31, 2026, up 29.6% from $14.93 billion a year earlier, and net income of $4.76 billion against $2.93 billion, with diluted EPS of $1.56, according to its SEC filing. It also filed a Form 8-K on November 4 reporting other material events. Strong top-line growth, yet a stock down 12.31% in a month — the market, not the income statement, is doing the talking right now.Key Levels & Scenarios
Two lines matter. Support sits at $115.00, the 20-day floor already touched. A decisive close below that opens the path toward the three-month low of $109.21, with the $102.04 level — one and a half times ATR beneath the price — as the outer marker of an extended move. On the other side, the stock needs a close above the 20-day resistance at $144.54 before any recovery case carries weight; the $127.96 level, one and a half times ATR above, marks the first meaningful upside test. The balance of evidence favors patience over action. Oversold Stochastic argues against fresh selling at the low; a fresh negative MACD, falling OBV and expanding bands argue against buying the dip.Technical Verdict: HOLD (wait & see)
HOLD (wait & see) is the call, consistent with JournalArta’s research score of -84 on a -100 to +100 scale. Three reasons carry the decision: price sits below its 50-day average of $134.92, the 20-day average is beneath the 50-day and falling, and the MACD histogram has just turned negative — with zero bullish signals offsetting them. The verdict is invalidated if price closes below the 20-day support at $115.00, which would confirm the breakdown rather than a pause. - Entry range: only on a confirmed close above $144.54 (20-day resistance) — not at the current level. - Exit target: $127.96 as the first objective in an upside scenario; the $109.21 three-month low in a downside break. - Stop protection: below $115.00; the distance to a wider stop is too great to justify a position, which is why the call stays on hold. For a non-trading reader: Oracle is a strong business whose shares are still sliding, and the technicals say wait for proof of a bottom before acting. *This is technical analysis, not investment advice.*Summary Data ORCL
| Last price | 115.00 USD |
| Change 1 day / 5 days / 1 month | -3.43% / -2.53% / -12.31% |
| Trend / MA-cross | downtrend / none |
| SMA20 / SMA50 | 125.26 / 134.92 |
| RSI (14) / Stochastic %K | 40.0 / 16.4 |
| Bollinger %B / ATR | 16% / 8.64 |
| Support / Resistance 20 days | 115.00 / 144.54 |
| Data as of | 18 November 2026 04:04 WIB |
| JournalArta research verdict (score) | Hold (-84) |
Today's full Buy and Sell list for US stocks →
Disclaimer: This technical analysis is generated automatically from exchange data and indicators calculated by JournalArta, for information and education only. The verdict and the entry, target and stop-loss levels are not investment advice or a solicitation to buy or sell any security. Investment decisions and their risks rest solely with the reader.
Track ORCL stock price daily: live levels, support/resistance and our full ORCL analysis history.
 Take the quizWhat Kind of Holiday Spender Are You? Take the Black Friday QuizStart →
- 1U.S. Emergency Alert Test Nov. 17 Is Not a Power Outage

- 2DUP Chairman Lord Morrow Loses Wife and Daughter Within Hours in NI

- 3NASA’s Curiosity Rover Burst Open a Rock and Found Pure Sulfur

- 4Women With Autoimmune Diseases Wait About 4 Years for Diagnosis, Study Finds

- 5Stock Market Today: Dow Futures Slip as Nasdaq Futures Climb Before Earnings

 Lifestyle · Food & Health4 Reasons to Eat Oatmeal, According to Nutrition Experts
 Lifestyle7 Signs Your Social Battery Is Running Low (and Why You Keep Cancelling Plans)
 Lifestyle · Food & HealthThanksgiving Food Safety: How Long Leftovers Last and the Safe Turkey Temperature
 Lifestyle7 Quiet Habits of Emotionally Intelligent People, According to Psychologists