GE Aerospace (GE) Stock Update: Rises 0.38%, Down 3.4% in Five Sessions
Technical analysis of GE stock on November 17, 2026: price 326.40 USD, trend uptrend, RSI 53.6, support 285.64, resistance 342.75.

Why GE is in focus today
- Fresh golden cross: SMA20 crossed above SMA50
- Healthy pullback near SMA20 (315.57) within an uptrend
Selected automatically from 80 NYSE (US) stocks by a technical-signal score with daily weighted randomisation — not a recommendation.
Trend and Price Action
The structural picture is constructive. The price sits above the 20-day and 50-day simple moving averages — the rolling averages traders use to smooth out daily noise — at 315.57 and 314.37 respectively. More importantly, the 20-day average crossed above the 50-day during the latest session, a pattern known as a golden cross and typically read as confirmation that the medium-term trend is turning upward. The 20-day average itself rose 1.82% over five days, which tells you the trend line is still climbing, not flattening. Yet the pullback is the more interesting detail. The stock is trading 71% of the way up its 20-day range of 285.64 to 342.75, after retreating from a three-month high of 375.58. A pullback toward the 20-day average inside an uptrend is often healthier than an uninterrupted sprint: it lets short-term holders exit and lets longer-term buyers accumulate closer to the trend line. The risk is that a “healthy pullback” becomes the start of a deeper correction if the averages fail to hold.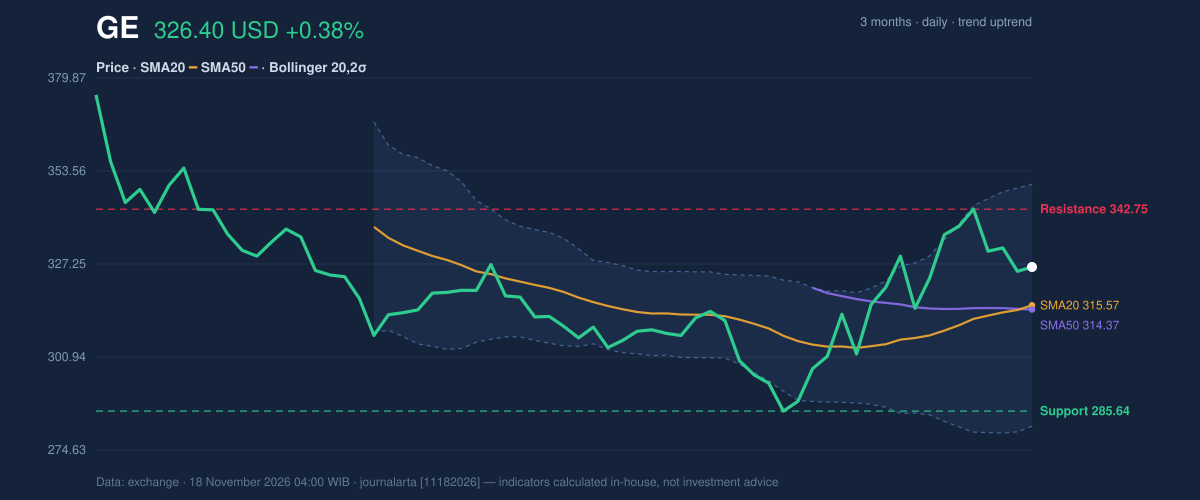
Oscillators and Momentum
Momentum is positive but not stretched. MACD — a measure of the gap between two moving averages — sits at 5.420 above its signal line at 3.834, with a histogram of 1.586. That is a clean bullish alignment. RSI at 53.6 is squarely neutral: not overbought, not oversold, leaving room in either direction. Stochastic is similarly non-committal, with %K at 60.6 below %D at 66.8, a mild short-term cooling signal rather than a reversal. The honest read: the trend and MACD say up, while RSI and Stochastic say there is no urgency to chase. That combination is common in pullbacks within uptrends — momentum has cooled without breaking.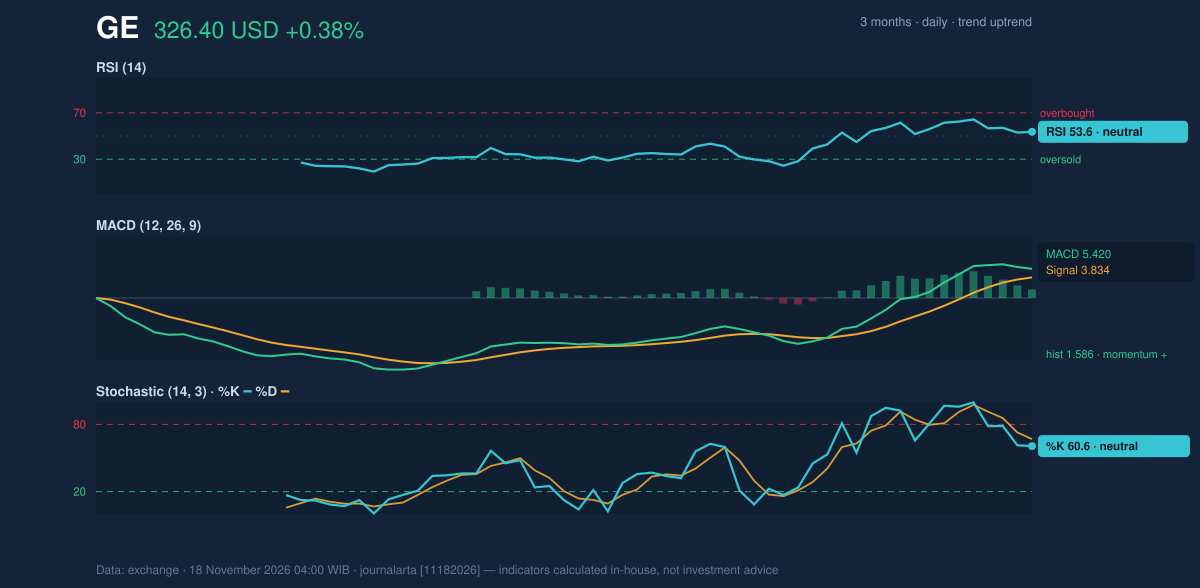
Volatility and Volume
Volatility is running hot. Bollinger bands — two standard deviations around the 20-day average — span 281.36 to 349.79, a width of 21.7% that is expanding. The price sits at 66% of that band, closer to the upper edge than the lower. ATR at 11.55, or 3.5% of the price, confirms that daily swings are wide; position sizing and stop placement need to respect that. Volume is the caution flag. The latest session traded 3,745,700 shares, just 0.7× the 20-day average of 5,263,635 — thin participation. On-Balance Volume is rising, which suggests accumulation over time, but a golden cross confirmed on below-average volume deserves scepticism until a heavier session validates it.Fundamental Context
The technical setup sits on solid reported numbers. According to its SEC filing, GE Aerospace reported quarterly revenue of $14.12 billion for the quarter ended September 30, 2026, up 15.9% from $12.18 billion a year earlier (Form 10-Q filed October 20, 2026). Net income was $2.29 billion, against $2.16 billion a year earlier, with diluted earnings per share of $2.20. Revenue growth outpacing profit growth implies margin pressure, but the absolute earnings base remains large.Key Levels and Scenarios
The level map is clear. Support sits at 285.64, with the 20-day and 50-day averages bunched just above it at 315.57 and 314.37 — a cluster that matters because a break below it would undermine the golden cross. Resistance is 342.75. If the price clears that, the path toward the three-month high of 375.58 opens. If it fails to hold the average cluster, the pullback deepens toward support, and the cross loses credibility.Technical Verdict: BUY
The verdict is BUY, based on three signals: the fresh golden cross (20-day above 50-day), a pullback to the 20-day average within an uptrend (price above the 50-day), and uptrend confirmation from rising OBV. MACD’s positive alignment supports it. The call is invalidated if the price breaks below 306.75. - Entry Range: 317.74 – 326.40 - Exit Target 1: 355.87 - Exit Target 2: 385.35 - Stop Loss: 306.75 - Reward/Risk: 1.5 / 3.0 - Valid Until: December 16, 2026 In plain English: the trend markers say buyers still have the upper hand, but thin volume means the signal needs confirmation before it can be trusted fully. This is technical analysis, not investment advice. The JournalArta research verdict stands at BUY with a score of +82 on a −100 to +100 scale, driven by 3 bullish versus 0 bearish technical signals.Summary Data GE
| Last price | 326.40 USD |
| Change 1 day / 5 days / 1 month | 0.38% / -3.41% / 8.85% |
| Trend / MA-cross | uptrend / golden |
| SMA20 / SMA50 | 315.57 / 314.37 |
| RSI (14) / Stochastic %K | 53.6 / 60.6 |
| Bollinger %B / ATR | 66% / 11.55 |
| Support / Resistance 20 days | 285.64 / 342.75 |
| Data as of | 18 November 2026 04:00 WIB |
| JournalArta research verdict (score) | Buy (+82) |
| Entry zone | 317.74 – 326.40 |
| Target 1 / 2 | 355.87 / 385.35 |
| Stop loss | 306.75 |
| Reward/risk | 1.5 / 3.0 |
Disclaimer: This technical analysis is generated automatically from exchange data and indicators calculated by JournalArta, for information and education only. The verdict and the entry, target and stop-loss levels are not investment advice or a solicitation to buy or sell any security. Investment decisions and their risks rest solely with the reader.
Track GE stock price daily: live levels, support/resistance and our full GE analysis history.
 Take the quizWhat Kind of Holiday Spender Are You? Take the Black Friday QuizStart →
Most Read
- 1U.S. Emergency Alert Test Nov. 17 Is Not a Power Outage

- 2DUP Chairman Lord Morrow Loses Wife and Daughter Within Hours in NI

- 3NASA’s Curiosity Rover Burst Open a Rock and Found Pure Sulfur

- 4Women With Autoimmune Diseases Wait About 4 Years for Diagnosis, Study Finds

- 5Stock Market Today: Dow Futures Slip as Nasdaq Futures Climb Before Earnings

Don't Miss
 Lifestyle · Food & Health4 Reasons to Eat Oatmeal, According to Nutrition Experts
 Lifestyle7 Signs Your Social Battery Is Running Low (and Why You Keep Cancelling Plans)
 Lifestyle · Food & HealthThanksgiving Food Safety: How Long Leftovers Last and the Safe Turkey Temperature
 Lifestyle7 Quiet Habits of Emotionally Intelligent People, According to Psychologists