Mondelez International (MDLZ) Stock Falls 1.17% on Tuesday, Trading Volume 1.5x Normal
Technical analysis of MDLZ stock on November 17, 2026: price 66.75 USD, trend uptrend, RSI 59.3, support 61.87, resistance 67.54.

Why MDLZ is in focus today
- Volume at 0.0× the 20-day average
Selected automatically from 4 NASDAQ (US) stocks by a technical-signal score with daily weighted randomisation — not a recommendation.
Trend & Price Action
The structural picture remains constructive. The last price sits above the 20-day average of $65.31, which itself sits above the 50-day average of $62.78 — the classic stacking that defines a rising trend for general readers. The 20-day average climbed 1.42% over the past five days, a slope that confirms the trend is being actively maintained rather than flattening. No fresh moving-average crossover has formed, so this is an established uptrend, not a new signal. Against its three-month range of $57.32 to $68.92, the stock is trading at roughly 86% of the 20-day range and within striking distance of the $67.54 resistance — the previous close it just lost. That is the immediate battleground. A daily close back above it would suggest the pullback was shallow; a failure to reclaim it keeps the stock in consolidation beneath the recent high.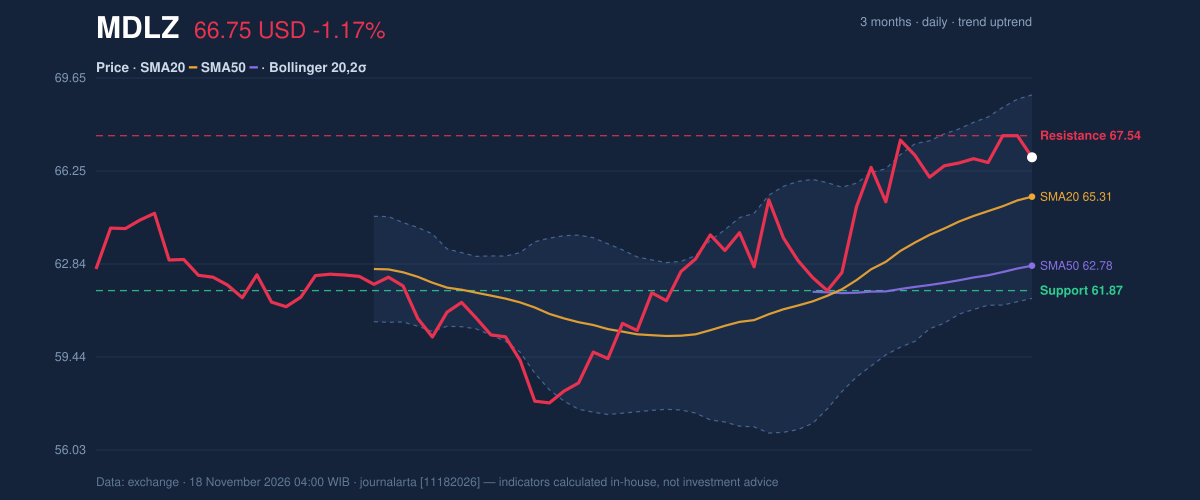
Oscillators & Momentum
Momentum is positive but not overheated. The MACD reads 1.324 against a signal line of 1.259, with a histogram of 0.065 — the MACD line remains above its signal, so the underlying momentum is still up, though the modest gap suggests it is steadying rather than accelerating. The RSI(14) at 59.3 is squarely neutral, sitting in the 50–70 zone that typically accompanies healthy trends rather than exhaustion. Stochastic tells a similar story: %K at 69.0 and %D at 77.9, with the faster line below the slower one. That positioning hints the immediate push is cooling, which fits a stock that has run 4.31% in a month and is pausing at resistance.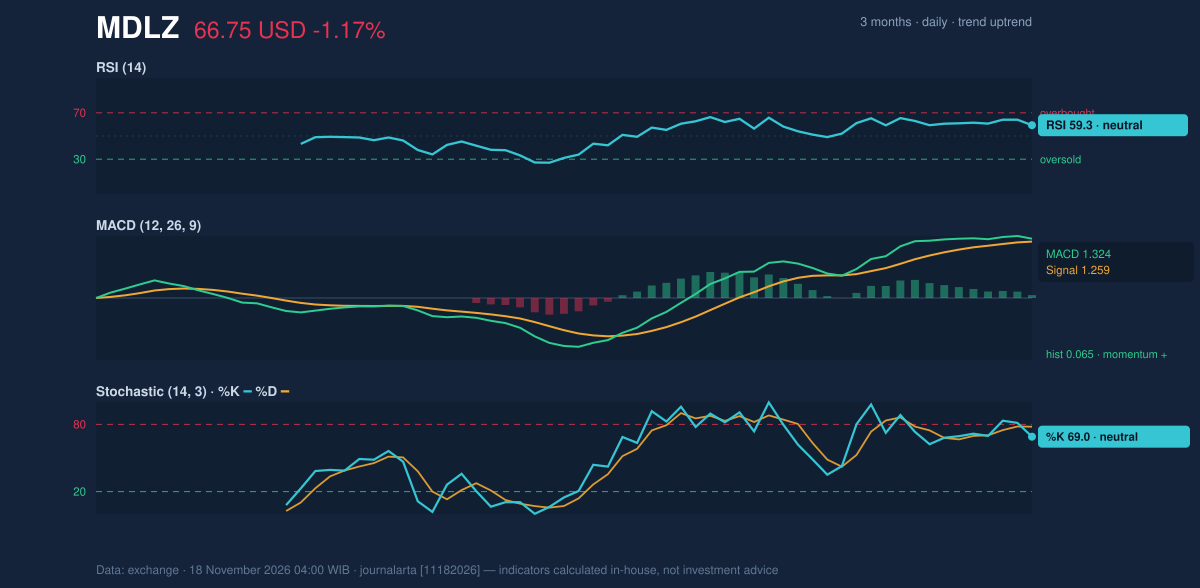
Volatility & Volume
The ATR(14) of 1.60, or about 2.4% of price, describes moderate volatility — enough for meaningful daily swings, not enough to suggest disorder. The heavier-than-usual volume on the down day is the one genuinely mixed signal. It argues that sellers were active, but it has not yet translated into a break of support, and the falling OBV means new money has not been chasing the stock at these levels.Fundamental Context
The operating backdrop gives the technical story a floor. According to its SEC filing, Mondelez reported quarterly revenue of $9.97 billion for the quarter ended September 30, 2026, up 2.3% from $9.74 billion a year earlier, with net income of $1.31 billion and diluted earnings per share of $1.02 — a notable improvement from $743.0 million a year prior. That revenue growth and profit recovery help explain why the stock has held its uptrend despite the recent pullback.Key Levels & Scenarios
The near-term map is tight. On the upside, clearing $67.54 reopens the path toward the three-month high of $68.92 and the upper Bollinger band at $69.03. On the downside, the 20-day average at $65.31 is the first line of defense; losing it would shift attention to support at $61.87, with the lower Bollinger band at $61.58 sitting just below. The stock's position above its averages means the burden of proof rests with sellers.Technical Verdict: BUY
The signals favor the upside. Three reasons stand out: the price trades above its 50-day average of $62.78 and the 20-day average sits above the 50-day, confirming an intact uptrend; the MACD histogram of 0.065 remains positive; and the RSI of 59.3 leaves room for further gains without an overbought warning. The pullback to the 20-day average within a rising trend is the bullish setup the data identifies. - Entry Range: $65.56 – $66.75 - Exit / Target Price: Target 1 at $70.83; Target 2 at $74.91 - Stop Loss: $64.03 - Reward/Risk: 1.5 to 3.0, valid until December 16, 2026 The verdict would be invalidated if the price breaks below the stop level of $64.03. In plain terms: the trend and momentum signals lean positive, but the heavier volume on this pullback means the next session's close around the $67.54 resistance will do much of the talking.Summary Data MDLZ
| Last price | 66.75 USD |
| Change 1 day / 5 days / 1 month | -1.17% / 0.32% / 4.31% |
| Trend / MA-cross | uptrend / none |
| SMA20 / SMA50 | 65.31 / 62.78 |
| RSI (14) / Stochastic %K | 59.3 / 69.0 |
| Bollinger %B / ATR | 69% / 1.60 |
| Support / Resistance 20 days | 61.87 / 67.54 |
| Data as of | 18 November 2026 04:00 WIB |
| JournalArta research verdict (score) | Buy (+71) |
| Entry zone | 65.56 – 66.75 |
| Target 1 / 2 | 70.83 / 74.91 |
| Stop loss | 64.03 |
| Reward/risk | 1.5 / 3.0 |
Today's full Buy and Sell list for US stocks →
Disclaimer: This technical analysis is generated automatically from exchange data and indicators calculated by JournalArta, for information and education only. The verdict and the entry, target and stop-loss levels are not investment advice or a solicitation to buy or sell any security. Investment decisions and their risks rest solely with the reader.
Track MDLZ stock price daily: live levels, support/resistance and our full MDLZ analysis history.
 Take the quizWhat Kind of Holiday Spender Are You? Take the Black Friday QuizStart →
- 1U.S. Emergency Alert Test Nov. 17 Is Not a Power Outage

- 2DUP Chairman Lord Morrow Loses Wife and Daughter Within Hours in NI

- 3NASA’s Curiosity Rover Burst Open a Rock and Found Pure Sulfur

- 4Women With Autoimmune Diseases Wait About 4 Years for Diagnosis, Study Finds

- 5Stock Market Today: Dow Futures Slip as Nasdaq Futures Climb Before Earnings

 Lifestyle · Food & Health4 Reasons to Eat Oatmeal, According to Nutrition Experts
 Lifestyle7 Signs Your Social Battery Is Running Low (and Why You Keep Cancelling Plans)
 Lifestyle · Food & HealthThanksgiving Food Safety: How Long Leftovers Last and the Safe Turkey Temperature
 Lifestyle7 Quiet Habits of Emotionally Intelligent People, According to Psychologists