International Airlines Share Price Update: Falls 1.87%, Trading Volume 2.5x Normal
Technical analysis of IAG stock on November 17, 2026: price 445.00 GBp, trend uptrend, RSI 56.9, support 394.70, resistance 458.50.

Why IAG is in focus today
- Volume at 0.0× the 20-day average
Selected automatically from 10 LSE (UK) stocks by a technical-signal score with daily weighted randomisation — not a recommendation.
Trend & Price Action
The defining development is a golden cross — the 20-day moving average closing above the 50-day average, formed one session before Tuesday's close. The 20-day average sits at 428.12 GBp and the 50-day at 425.73 GBp, placing the price above both. Critically, the 20-day average rose 2.32% over five days, confirming that the floor under the price is itself rising. That is the signature of a constructive uptrend, and it explains why a modest two-session dip has not broken structure.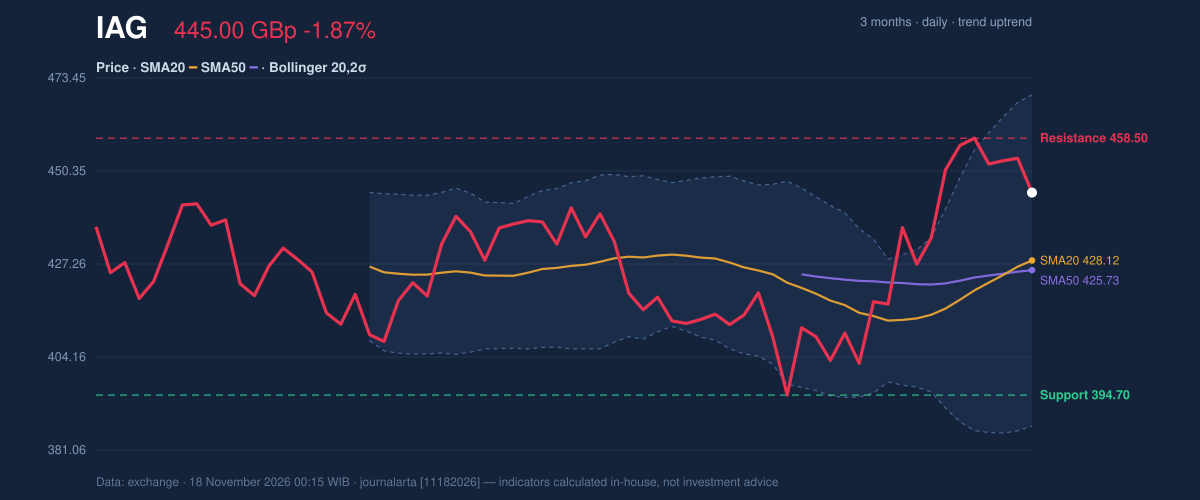
Oscillators & Momentum
Momentum is supportive but not stretched. The RSI(14) reads 56.9, squarely neutral — the bearish signal in the code model flags a rolling over from above 65, meaning the stock has cooled from a hot reading rather than broken down. MACD is more encouraging: the line at 8.888 sits above its signal at 5.767, with a positive histogram of 3.121, which means short-term momentum is still accelerating relative to the longer measure.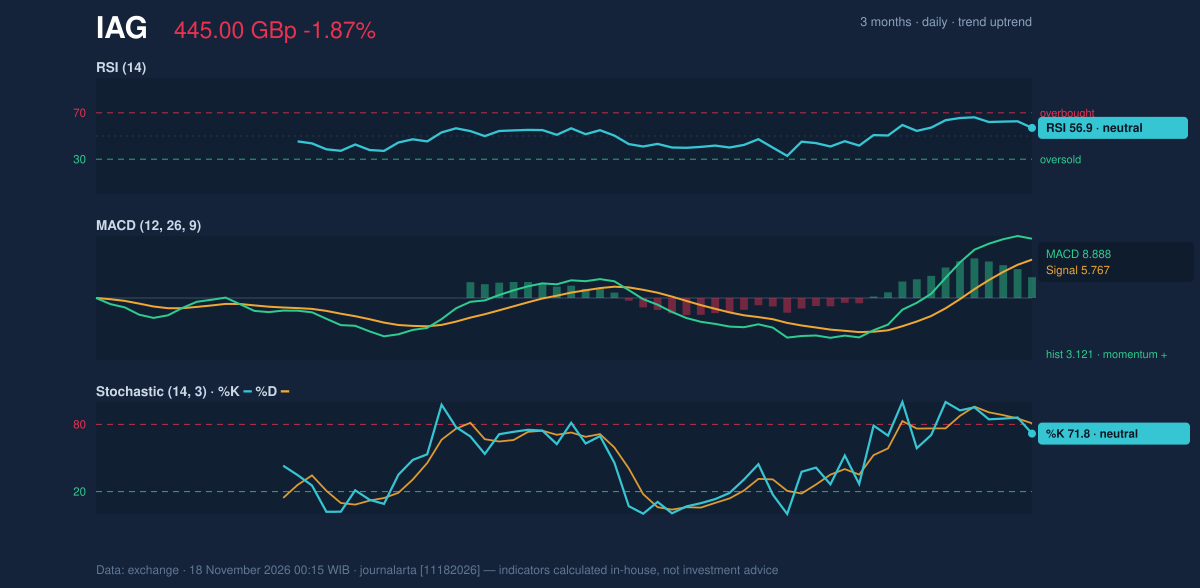
Volatility & Volume
Volatility is moderate. ATR(14) of 14.15 GBp equals 3.2% of the price, so daily swings of a few percent should be expected rather than treated as alarms. Bollinger bands span 386.98 GBp to 469.25 GBp, a width of 19.2% — described as normal, meaning no squeeze is coiling for an imminent explosive move. %B at 71% puts the price in the upper third of the band without touching the ceiling. Volume is where the story gets sharp. The latest session traded 33.6 million shares against a 20-day average of 13.4 million — a 2.5× surge — while the selection screen for the day recorded volume at 0.0× average. That inconsistency is the analytical puzzle. The heavy turnover behind a down day suggests profit-taking into strength after the one-month gain, with the rising OBV confirming that the underlying volume trend still favours accumulation.Key Levels & Scenarios
The immediate decision point is the 20-day average at 428.12 GBp. If buyers defend it, the path of least resistance runs toward resistance at 458.50 GBp and then the 461.70 GBp three-month high. If it fails, the next structural floor is the 20-day support zone at 394.70 GBp. Volatility argues for patience: with the Stochastic cooling, a fresh push above resistance without an RSI reset would be the weaker scenario.Technical Verdict: BUY
The JournalArta research model scores the stock +69 on a scale from −100 to +100, above the +60 buy threshold, driven by three bullish signals against one bearish and an uptrend that code confirms. - Momentum: MACD positive and above signal, with a rising 20-day average. - Structure: fresh golden cross with price above both moving averages. - Participation: OBV rising, confirming the volume trend. - Invalidation: the verdict weakens if price falls below 420.94 GBp. - Entry zone: 434.39 – 445.00 GBp. - Exit targets: 481.09 GBp and 517.18 GBp. - Stop loss: 420.94 GBp — reward-to-risk of 1.5 to 3.0. - Valid until: 16 December 2026. In plain English: the trend and momentum data point to a constructive setup, but the soft Stochastic and heavy down-day volume argue for buying into the pullback rather than chasing the highs. The setup's validity runs to 16 December 2026, with a stop at 420.94 GBp.Summary Data IAG
| Last price | 445.00 GBp |
| Change 1 day / 5 days / 1 month | -1.87% / -2.56% / 7.33% |
| Trend / MA-cross | uptrend / golden |
| SMA20 / SMA50 | 428.12 / 425.73 |
| RSI (14) / Stochastic %K | 56.9 / 71.8 |
| Bollinger %B / ATR | 71% / 14.15 |
| Support / Resistance 20 days | 394.70 / 458.50 |
| Data as of | 18 November 2026 00:15 WIB |
| JournalArta research verdict (score) | Buy (+69) |
| Entry zone | 434.39 – 445.00 |
| Target 1 / 2 | 481.09 / 517.18 |
| Stop loss | 420.94 |
| Reward/risk | 1.5 / 3.0 |
Today's full Buy and Sell list for UK, Singapore & Hong Kong stocks →
Disclaimer: This technical analysis is generated automatically from exchange data and indicators calculated by JournalArta, for information and education only. The verdict and the entry, target and stop-loss levels are not investment advice or a solicitation to buy or sell any security. Investment decisions and their risks rest solely with the reader.
Track IAG share price daily: live levels, support/resistance and our full IAG analysis history.
 Take the quizWhat Kind of Holiday Spender Are You? Take the Black Friday QuizStart →
- 1U.S. Emergency Alert Test Nov. 17 Is Not a Power Outage

- 2DUP Chairman Lord Morrow Loses Wife and Daughter Within Hours in NI

- 3NASA’s Curiosity Rover Burst Open a Rock and Found Pure Sulfur

- 4Women With Autoimmune Diseases Wait About 4 Years for Diagnosis, Study Finds

- 5Stock Market Today: Dow Futures Slip as Nasdaq Futures Climb Before Earnings

 Lifestyle7 Signs Your Social Battery Is Running Low (and Why You Keep Cancelling Plans)
 Lifestyle · Food & HealthThanksgiving Food Safety: How Long Leftovers Last and the Safe Turkey Temperature
 Lifestyle7 Quiet Habits of Emotionally Intelligent People, According to Psychologists
 LifestylePeople Who Don’t Like Celebrating Their Birthday Often Share These 7 Traits