Fortescue Share Price Tumbles 5.55% on Tuesday, Down 10.7% in a Month
Technical analysis of Fortescue stock on November 17, 2026: price 13.62 AUD, trend downtrend, RSI 31.7, support 13.62, resistance 15.49.

Why Fortescue is in focus today
- One-day move of 0.00%, about 0.0× its average daily range (ATR)
- Volume at 0.0× the 20-day average
Selected automatically from 9 ASX (Australia) stocks by a technical-signal score with daily weighted randomisation — not a recommendation.
Trend & Price Action
The shares are down 11.33% over five days and 10.75% over one month. At A$13.62, Fortescue is below both its A$14.70 20-day average and A$15.60 50-day average. The 20-day average itself fell 0.91% over five days, while the longer average remains higher—an alignment consistent with a downtrend, not a confirmed reversal. No new moving-average cross has formed. The latest price is also below the lower Bollinger Band, at A$13.72, with %B at -5%. Bollinger Bands map how far a price has moved relative to its recent average; a reading below the lower band signals an unusually weak position in that range, but does not by itself establish that a rebound is imminent. The band width is 13.4%, described as normal, so the move has not come with an exceptional expansion in this volatility measure. As shown in the chart, the price is at the bottom of its three-month range, whose high is A$18.34 and low is A$13.62. The A$13.62 support therefore coincides with the period low, making its ability to hold a key test. The chart also shows the moving averages and resistance at A$15.49.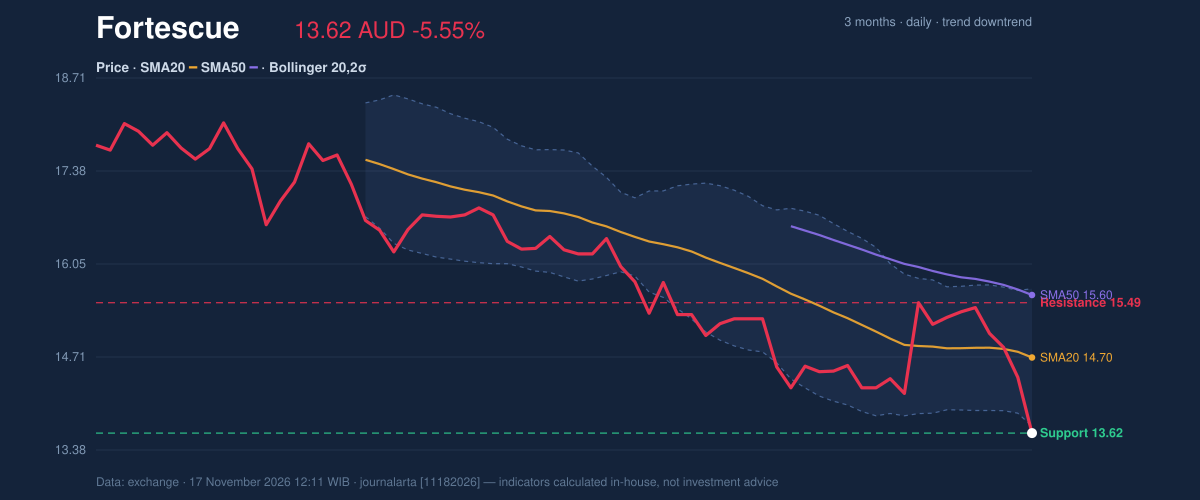
Oscillators & Momentum
The indicators offer little confirmation of a floor. RSI is 31.7, classified as neutral in the supplied data, while Stochastic is oversold: %K is 0.0 against %D at 26.1. Oversold readings can occur during sharp declines and are not, alone, evidence that selling has ended. MACD remains negative at -0.281, below its -0.267 signal line, with a negative histogram of -0.014. That configuration indicates downside momentum is still in place. The chart brings the RSI, MACD and Stochastic readings together; here, the oversold Stochastic is a caution against assuming the decline will continue in a straight line, but the negative MACD does not yet confirm a turn.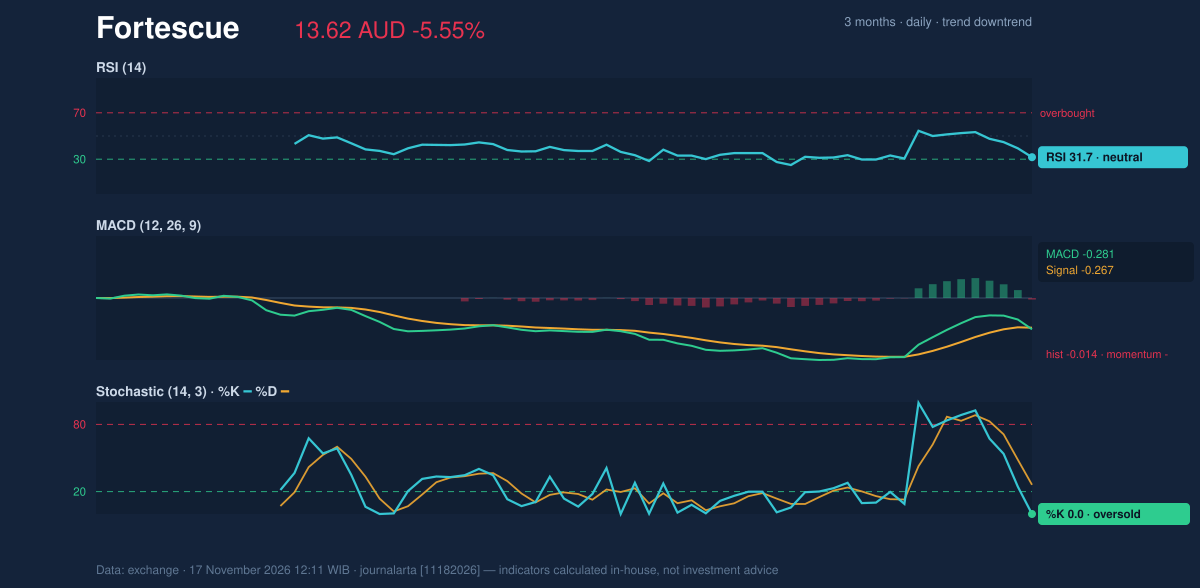
Volatility, Volume & Key Levels
Volume reached 13,629,820 shares, compared with a 20-day average of 8,409,318. The heavier turnover strengthens the significance of the decline: more shares changed hands as the price broke below its 20-day low. OBV, a running measure of whether volume is accumulating on rising or falling sessions, is also declining. Together, those signals suggest participation has been tilted toward distribution. ATR is A$0.44, or 3.2% of the share price, indicating moderate day-to-day volatility. If A$13.62 fails to hold, the supplied technical targets are A$12.50 and A$11.37. A recovery toward A$15.49 would challenge the nearest stated resistance; the 20-day average at A$14.70 is another reference point, but price remains beneath it.Technical Verdict: SELL
The JournalArta Research Verdict is SELL, consistent with the supplied score of -89 and three bearish signals against none bullish. The strongest evidence is the close below the 20-day low on volume at least 1.5 times average, the newly negative MACD histogram, and falling OBV in a confirmed downtrend. The verdict is invalidated if price rises above the specified stop-loss level of A$14.37.- Entry range: A$13.62–A$13.94
- Exit targets: A$12.50 (Target 1) and A$11.37 (Target 2)
- Stop-loss protection: A$14.37
| Indicator | Reading |
|---|---|
| Last price | A$13.62 |
| Change | 1 day -5.55% | 5 days -11.33% | 1 month -10.75% |
| SMA20 / SMA50 | A$14.70 / A$15.60 |
| RSI / Stochastic | 31.7 / %K 0.0, %D 26.1 |
| MACD / histogram | -0.281 / -0.014 |
| Volume / 20-day average | 13,629,820 / 8,409,318 |
| Support / resistance | A$13.62 / A$15.49 |
| Verdict validity | Through December 15, 2026 |
Summary Data Fortescue
| Last price | 13.62 AUD |
| Change 1 day / 5 days / 1 month | -5.55% / -11.33% / -10.75% |
| Trend / MA-cross | downtrend / none |
| SMA20 / SMA50 | 14.70 / 15.60 |
| RSI (14) / Stochastic %K | 31.7 / 0.0 |
| Bollinger %B / ATR | -5% / 0.44 |
| Support / Resistance 20 days | 13.62 / 15.49 |
| Data as of | 17 November 2026 12:11 WIB |
| JournalArta research verdict (score) | Sell (-89) |
| Sell zone | 13.62 – 13.94 |
| Target 1 / 2 | 12.50 / 11.37 |
| Stop loss | 14.37 |
| Reward/risk | 1.5 / 3.0 |
Today's full Buy and Sell list for Australian stocks (ASX) →
Disclaimer: This technical analysis is generated automatically from exchange data and indicators calculated by JournalArta, for information and education only. The verdict and the entry, target and stop-loss levels are not investment advice or a solicitation to buy or sell any security. Investment decisions and their risks rest solely with the reader.
Track Fortescue share price daily: live levels, support/resistance and our full Fortescue analysis history.
 Take the quizWhat Kind of Holiday Spender Are You? Take the Black Friday QuizStart →
- 1U.S. Emergency Alert Test Nov. 17 Is Not a Power Outage

- 2DUP Chairman Lord Morrow Loses Wife and Daughter Within Hours in NI

- 3Women With Autoimmune Diseases Wait About 4 Years for Diagnosis, Study Finds

- 4NASA’s Curiosity Rover Burst Open a Rock and Found Pure Sulfur

- 5Stock Market Today: Dow Futures Slip as Nasdaq Futures Climb Before Earnings

 Lifestyle7 Signs Your Social Battery Is Running Low (and Why You Keep Cancelling Plans)
 Lifestyle · Food & HealthThanksgiving Food Safety: How Long Leftovers Last and the Safe Turkey Temperature
 Lifestyle7 Quiet Habits of Emotionally Intelligent People, According to Psychologists
 LifestylePeople Who Don’t Like Celebrating Their Birthday Often Share These 7 Traits