M&G Share Price Update: Falls 1.96%, Up 4.8% in a Month
Technical analysis of M&G stock on November 17, 2026: price 325.70 GBp, trend uptrend, RSI 52.2, support 312.30, resistance 333.30.

Why M&G is in focus today
Selected automatically from 10 LSE (UK) stocks by a technical-signal score with daily weighted randomisation — not a recommendation.
A Cross, Not a Breakout — Yet
The golden cross formed on the latest session (Tuesday, November 17, 2026), with the 20-day average cutting above the 50-day average. On its own, a crossover is a lagging signal: it confirms what already happened. What gives it weight here is the 20-day average itself, which rose 1.56% over five days — not a sharp lurch, but a steady-up gradient that tells you buyers have been accumulating rather than chasing. The price sits at 64% of its 20-day trading range, between support at 312.30 and resistance at 333.30. That is the upper-middle of the range: comfortably above the floor, but not yet pressing the ceiling. The three-month high of 360.00 and low of 302.30 frame the wider picture — the stock is trading roughly mid-way through that band, meaning the trend has repaired but has not yet reclaimed its highs.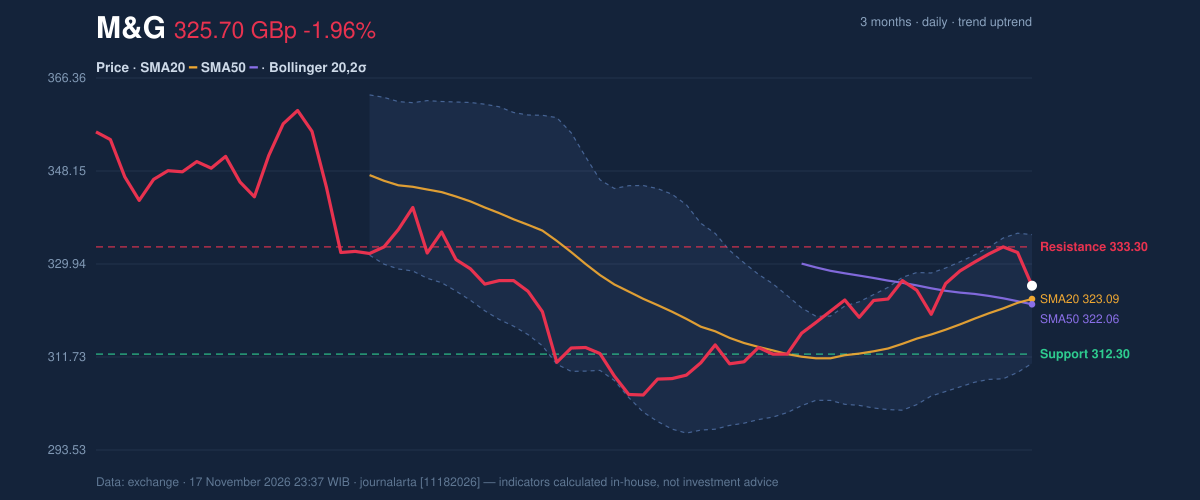
Momentum Is Positive but Not Crowded
The oscillators are neutral, and that is a feature rather than a flaw. RSI(14) at 52.2 sits almost exactly at the midpoint — neither overbought nor oversold — which leaves room for the trend to extend without immediate resistance from stretched positioning. Stochastic readings are mixed: %K at 49.7 against %D at 74.7 shows the fast line sitting well below the slow line, a short-term cooling signal consistent with the day’s 1.96% decline. The more telling divergence is in the MACD. The line reads 2.858 against a signal of 1.737, producing a positive histogram of 1.121. That is momentum expanding, not merely positive. When price dips while MACD holds its spread, the pullback reads as consolidation inside an uptrend rather than the start of a reversal. Traders would want to see the histogram keep its sign on the next few sessions to validate that reading.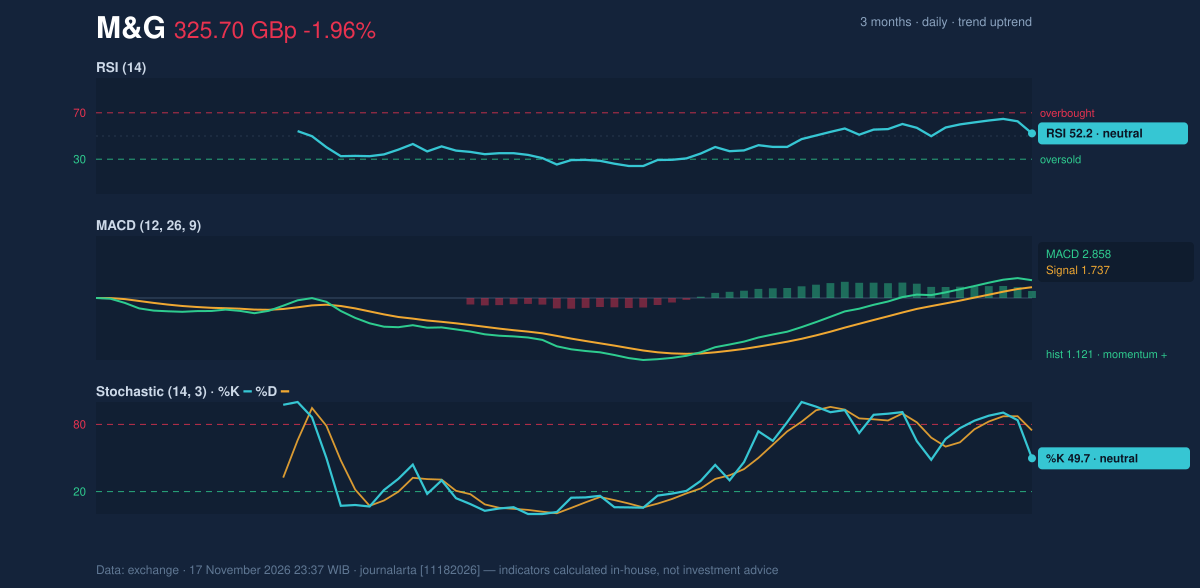
The Squeeze Sets Up the Next Move
Bollinger Bands are narrowing: the band width is 7.8%, with the upper band at 335.70, the middle at 323.09 and the lower at 310.48. %B at 60% places the price in the upper half of the envelope, closer to the top band than the middle. A squeeze is not a direction — it is stored energy. Historically it precedes an expansion in volatility, and the direction of that expansion is usually dictated by which band breaks first. Average True Range is 6.41, or 2.0% of the price — moderate volatility, not complacent but not disorderly. In practice, this means a move toward the 333.30 resistance is achievable within roughly one ATR of the current price, while a full breakdown to the 312.30 support would take several sessions of sustained selling. Volume is the quiet confirmation. The latest session traded 3,990,137 shares against a 20-day average of 4,041,633 — essentially 1.0× normal. A down day on average volume is not distribution; it is absence of urgency. Meanwhile, On-Balance Volume is rising, which means cumulative buying pressure has been building even as the price consolidates. That is participation confirming the trend, and it is the third prong of the technical case.Key Levels and the Conditions That Matter
The levels are tightly grouped, which makes the setup easy to read. A daily close above 333.30 would clear the 20-day resistance and open the path toward the upper Bollinger band at 335.70 and then the three-month high of 360.00. Failure to hold 312.30 would break the 20-day support and put the lower band at 310.48 in play — and a close below that would call the golden cross into question, since the 50-day average at 322.06 would then be overhead rather than beneath. The more likely near-term path, given the squeeze and the positive MACD, is a retest of resistance. But the stock has to earn it: the 1.96% decline shows sellers are not absent, and a second down session on rising volume would flip the OBV signal.Technical Verdict: BUY
The verdict is BUY, supported by three aligned signals: the fresh golden cross with the 20-day average rising 1.56% over five sessions; a pullback to the 20-day average within an uptrend, with price holding above the 50-day; and rising OBV confirming participation. The computed score of +82 on a −100 to +100 scale reflects three bullish signals against none bearish. The verdict is invalidated if the price breaks below 311.01, the stop level, which sits just under the 20-day support and the lower Bollinger band. - Entry Range: 320.89 – 325.70 - Exit Target 1: 347.73 - Exit Target 2: 369.77 - Stop Loss: 311.01 - Reward/Risk: 1.5 to 3.0 - Valid Until: 15 December 2026 In plain English: the chart says the stock has turned the corner, and the current dip looks like a pause rather than a reversal — but the setup only holds if the 311.01 floor stays intact. This is technical analysis based on exchange data, not an investment recommendation.| Indikator | Nilai | Status |
|---|---|---|
| Harga terakhir | 325.70 GBp | DI ATAS SMA20 |
| Perubahan | 1 hari: -1.96% | 5 hari: -0.88% | 1 bulan: +4.79% | — |
| SMA20 / SMA50 | 323.09 / 322.06 | Golden cross (sesi terakhir) |
| Bollinger(20,2σ) | Atas: 335.70 | Tengah: 323.09 | Bawah: 310.48 | Menyempit (lebar pita 7.8%), %B 60% |
| RSI(14) | 52.2 | Netral |
| Stochastic | %K 49.7 / %D 74.7 | Netral |
| MACD | 2.858 | Signal 1.737 | Histogram 1.121 | Momentum positif |
| ATR(14) | 6.41 (2.0% dari harga) | Volatilitas sedang |
| Volume | 3,990,137 (1.0× rata-rata 20h) | Normal, OBV naik |
| Support / Resistance 20h | 312.30 / 333.30 | Posisi 64% rentang |
| High / Low 3 bulan | 360.00 / 302.30 | — |
| Verdict | BUY (skor +82) | Entry 320.89–325.70 | Target 347.73/369.77 | SL 311.01 |
Summary Data M&G
| Last price | 325.70 GBp |
| Change 1 day / 5 days / 1 month | -1.96% / -0.88% / 4.79% |
| Trend / MA-cross | uptrend / golden |
| SMA20 / SMA50 | 323.09 / 322.06 |
| RSI (14) / Stochastic %K | 52.2 / 49.7 |
| Bollinger %B / ATR | 60% / 6.41 |
| Support / Resistance 20 days | 312.30 / 333.30 |
| Data as of | 17 November 2026 23:37 WIB |
| JournalArta research verdict (score) | Buy (+82) |
| Entry zone | 320.89 – 325.70 |
| Target 1 / 2 | 347.73 / 369.77 |
| Stop loss | 311.01 |
| Reward/risk | 1.5 / 3.0 |
Today's full Buy and Sell list for UK, Singapore & Hong Kong stocks →
Disclaimer: This technical analysis is generated automatically from exchange data and indicators calculated by JournalArta, for information and education only. The verdict and the entry, target and stop-loss levels are not investment advice or a solicitation to buy or sell any security. Investment decisions and their risks rest solely with the reader.
Track M&G share price daily: live levels, support/resistance and our full M&G analysis history.
 Take the quizWhat Kind of Holiday Spender Are You? Take the Black Friday QuizStart →
- 1U.S. Emergency Alert Test Nov. 17 Is Not a Power Outage

- 2DUP Chairman Lord Morrow Loses Wife and Daughter Within Hours in NI

- 3NASA’s Curiosity Rover Burst Open a Rock and Found Pure Sulfur

- 4Women With Autoimmune Diseases Wait About 4 Years for Diagnosis, Study Finds

- 5Stock Market Today: Dow Futures Slip as Nasdaq Futures Climb Before Earnings

 Lifestyle7 Signs Your Social Battery Is Running Low (and Why You Keep Cancelling Plans)
 Lifestyle · Food & HealthThanksgiving Food Safety: How Long Leftovers Last and the Safe Turkey Temperature
 Lifestyle7 Quiet Habits of Emotionally Intelligent People, According to Psychologists
 LifestylePeople Who Don’t Like Celebrating Their Birthday Often Share These 7 Traits