JB Hi-Fi Share Price Falls 1.03%: Down 2.1% in Five Sessions
Technical analysis of JB Hi-Fi stock on November 17, 2026: price 75.77 AUD, trend uptrend, RSI 56.8, support 68.62, resistance 77.41.

Why JB Hi-Fi is in focus today
Selected automatically from 9 ASX (Australia) stocks by a technical-signal score with daily weighted randomisation — not a recommendation.
Trend & Price Action
The price is above the 20-day simple moving average (SMA) of A$74.46 and the 50-day average of A$71.05. The 20-day average rose 1.50% over five days, and its position above the 50-day average reinforces the uptrend. No new moving-average crossover formed in the latest session: the pattern supports the existing trend, rather than signalling a fresh change in direction. The stock’s one-month gain of 3.51% contrasts with declines of 2.06% over five days and 1.03% in the latest session. That combination points to a short-term retreat within a stronger monthly advance. The price is at 81% of its 20-session range, with support at A$68.62 and resistance at A$77.41. It also remains below the three-month high of A$78.73. As shown in the chart, the price is near the upper portion of its recent range, while the moving averages slope upward. The Bollinger middle band, which tracks the 20-day average, stands at A$74.46; the upper and lower bands are A$79.50 and A$69.42.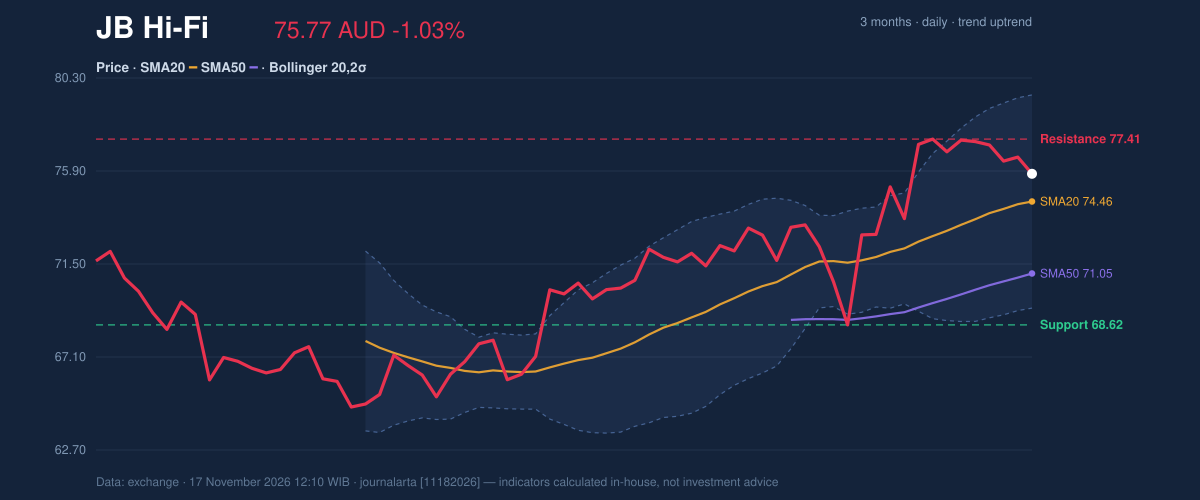
Oscillators & Momentum
The RSI, a measure of the pace of recent price changes, is 56.8, in neutral territory and consistent with moderate positive momentum rather than an overheated market. Stochastic readings are also neutral: %K is 72.0 and %D is 76.4. With %K below %D, the pair suggests some near-term cooling, though not a decisive reversal on its own. MACD momentum is positive but almost flat: the MACD is 1.596 against a 1.594 signal line, with a histogram of 0.001. The near-equality indicates that upward momentum is present but offers little evidence of acceleration. The chart brings those signals together, showing whether momentum is confirming the price trend or starting to diverge.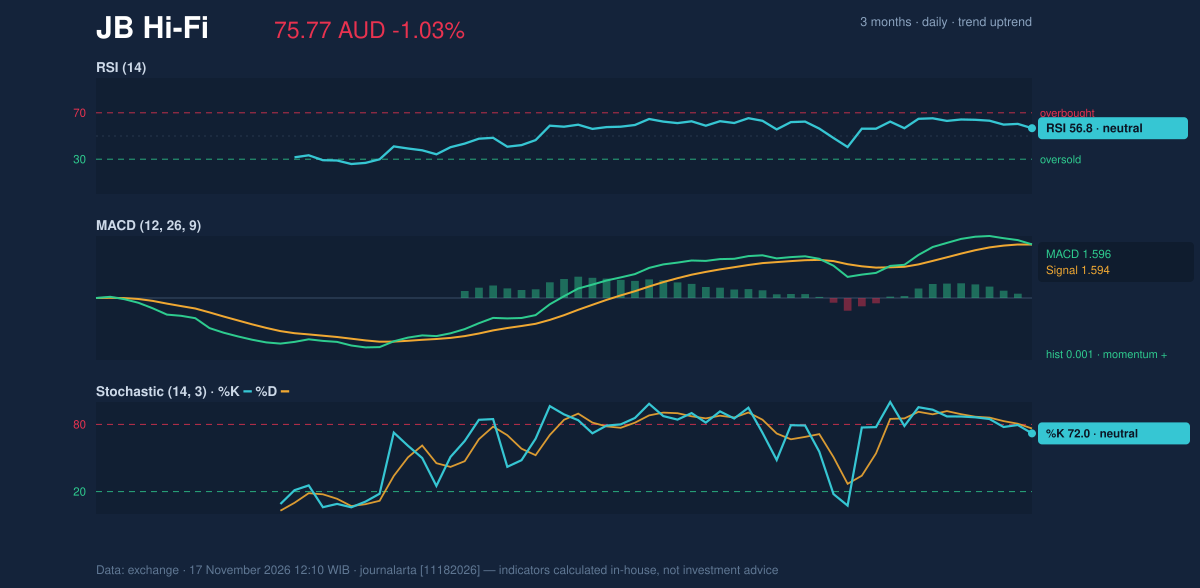
Volatility & Volume
The Bollinger bandwidth is 13.5%, described as normal, while the price sits at 63% of the band range. This places it above the middle band but short of the upper boundary, leaving room for movement in either direction without a band signal of unusually compressed or expanded volatility. Average true range (ATR), a measure of typical daily movement, is A$2.04, or 2.7% of the share price—moderate volatility. Volume was 383,084 shares, about 0.7 times the 20-session average of 574,642, while on-balance volume (OBV), which tracks whether volume tends to accompany rising or falling prices, was declining. That weak participation makes the latest pullback less conclusive as evidence of strong selling, but it also means the trend has not been confirmed by rising volume. A move through resistance would carry more weight if participation improved.Technical Verdict: BUY
BUY is the JournalArta Research verdict, supported by the share price above its 50-day average, the 20-day average above the 50-day, and the continuing uptrend. RSI at 56.8 adds a moderate-momentum signal, while the flat MACD histogram and falling OBV temper the strength of that picture. The verdict is invalidated if the price falls below the A$72.30 stop-loss level. - Ideal Entry Range: A$74.25–A$75.77 - Exit Target: Target 1 at A$80.97; Target 2 at A$86.18 - Stop Loss: A$72.30 - Validity: Until December 15, 2026 For non-traders, the verdict means the technical signals favour the existing upward trend, while the stated price levels define where that reading would be tested. | Indicator | Reading | |---|---:| | Latest price | A$75.77 | | Change: 1 day / 5 days / 1 month | −1.03% / −2.06% / +3.51% | | SMA20 / SMA50 | A$74.46 / A$71.05 | | RSI(14) | 56.8 | | Stochastic %K / %D | 72.0 / 76.4 | | MACD / signal / histogram | 1.596 / 1.594 / 0.001 | | Bollinger bands: upper / middle / lower | A$79.50 / A$74.46 / A$69.42 | | ATR(14) | A$2.04 | | Volume / 20-session average | 383,084 / 574,642 | | Support / resistance (20 sessions) | A$68.62 / A$77.41 |Summary Data JB Hi-Fi
| Last price | 75.77 AUD |
| Change 1 day / 5 days / 1 month | -1.03% / -2.06% / 3.51% |
| Trend / MA-cross | uptrend / none |
| SMA20 / SMA50 | 74.46 / 71.05 |
| RSI (14) / Stochastic %K | 56.8 / 72.0 |
| Bollinger %B / ATR | 63% / 2.04 |
| Support / Resistance 20 days | 68.62 / 77.41 |
| Data as of | 17 November 2026 12:10 WIB |
| JournalArta research verdict (score) | Buy (+66) |
| Entry zone | 74.25 – 75.77 |
| Target 1 / 2 | 80.97 / 86.18 |
| Stop loss | 72.30 |
| Reward/risk | 1.5 / 3.0 |
Today's full Buy and Sell list for Australian stocks (ASX) →
Disclaimer: This technical analysis is generated automatically from exchange data and indicators calculated by JournalArta, for information and education only. The verdict and the entry, target and stop-loss levels are not investment advice or a solicitation to buy or sell any security. Investment decisions and their risks rest solely with the reader.
Track JB Hi-Fi share price daily: live levels, support/resistance and our full JB Hi-Fi analysis history.
 Take the quizWhat Kind of Holiday Spender Are You? Take the Black Friday QuizStart →
- 1U.S. Emergency Alert Test Nov. 17 Is Not a Power Outage

- 2DUP Chairman Lord Morrow Loses Wife and Daughter Within Hours in NI

- 3Women With Autoimmune Diseases Wait About 4 Years for Diagnosis, Study Finds

- 4NASA’s Curiosity Rover Burst Open a Rock and Found Pure Sulfur

- 5Stock Market Today: Dow Futures Slip as Nasdaq Futures Climb Before Earnings

 Lifestyle7 Signs Your Social Battery Is Running Low (and Why You Keep Cancelling Plans)
 Lifestyle · Food & HealthThanksgiving Food Safety: How Long Leftovers Last and the Safe Turkey Temperature
 Lifestyle7 Quiet Habits of Emotionally Intelligent People, According to Psychologists
 LifestylePeople Who Don’t Like Celebrating Their Birthday Often Share These 7 Traits