Woolworths Share Price on Tuesday: Falls 0.36%, Up 1% in a Month
Technical analysis of Woolworths stock on November 17, 2026: price 42.04 AUD, trend uptrend, RSI 59.7, support 39.46, resistance 42.47.

Why Woolworths is in focus today
Selected automatically from 9 ASX (Australia) stocks by a technical-signal score with daily weighted randomisation — not a recommendation.
Trend & Price Action
Woolworths is up 1.03% over one month, despite a 0.10% decline over five sessions. The share price is above its 20-day simple moving average (SMA) of A$41.32 and its 50-day average of A$39.92. The 20-day average rose 0.65% over five days, a sign that the underlying trend is improving rather than merely reflecting a single session’s move. No new moving-average crossover has formed. The price is 86% of the way through its 20-session range, with support at A$39.46 and resistance at A$42.47. It is also near the three-month high of A$42.73. That location matters: buyers have kept the price elevated, but the share has less room before it meets a level where selling pressure may emerge. The chart places the price above its rising average, while showing the nearby resistance and the wider band boundaries.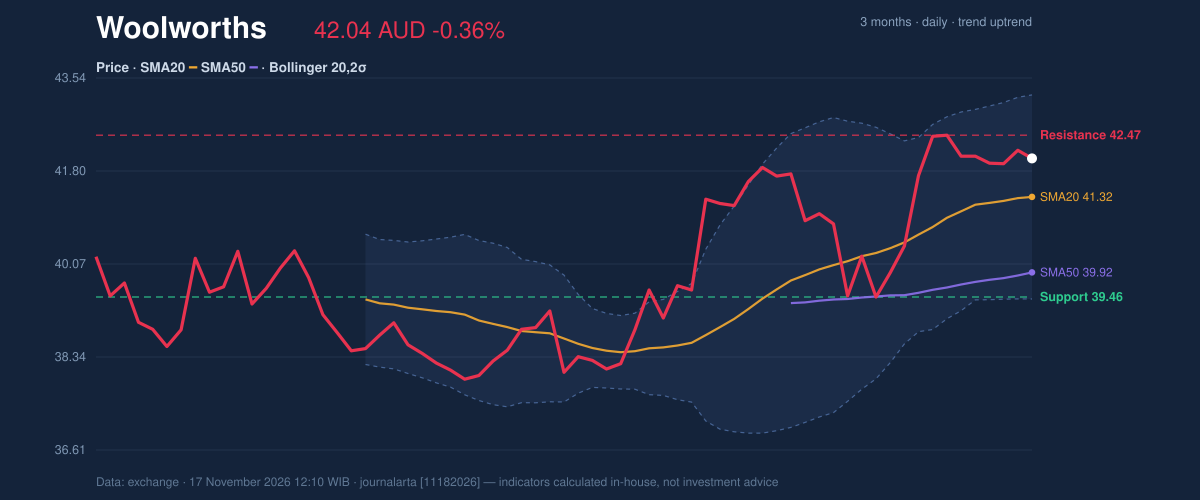
Oscillators & Momentum
The indicators give a mixed but not contradictory reading. The RSI is neutral at 59.7, consistent with positive momentum that has not reached an extreme. The Stochastic is overbought, with %K at 81.0 and %D at 81.5; this can signal that recent gains have run ahead of the short-term pace, though it does not by itself establish a reversal. The MACD is positive at 0.597, above its 0.555 signal line, with a positive 0.043 histogram. MACD compares short- and longer-term price averages to gauge momentum; its current alignment supports the broader uptrend. The indicators therefore point to strength, but the Stochastic reading makes a pause or pullback plausible. The momentum chart brings the RSI, MACD and Stochastic readings together, showing why the trend remains constructive even as the short-term oscillator is stretched.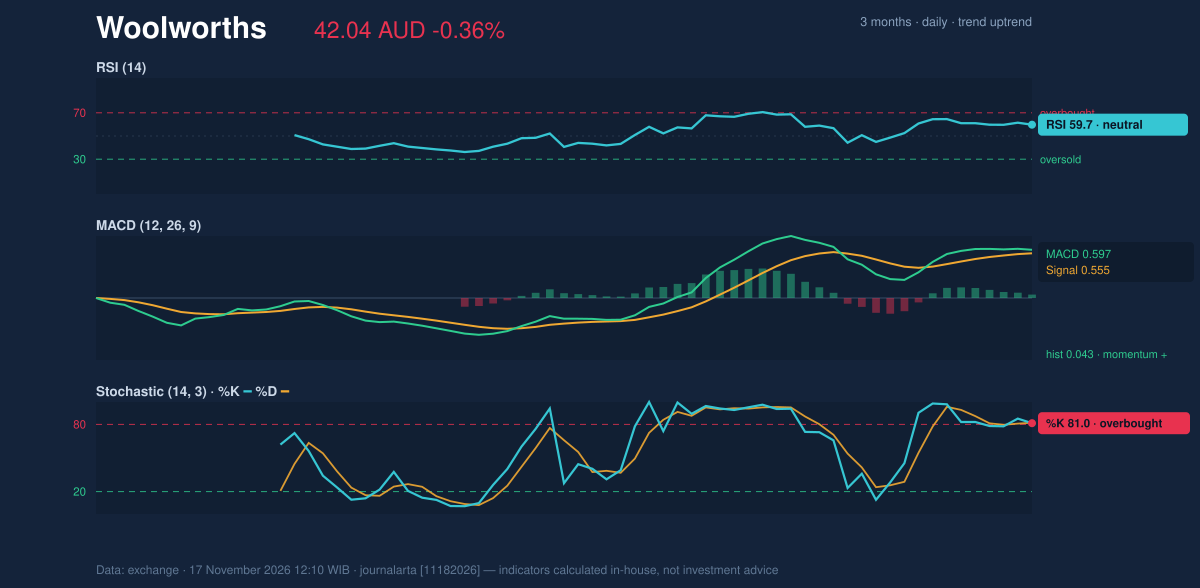
Volatility & Trading Activity
The Bollinger Band position is firm but not at an extreme. The %B reading of 69% places the price in the upper portion of the band, whose boundaries are A$39.42 and A$43.22; the band width is 9.2%, classified as normal rather than unusually tight or wide. This indicates upward positioning without evidence, from the band data alone, of a volatility squeeze. Average True Range (ATR) is A$0.88, or 2.1% of the share price, pointing to moderate daily volatility. That provides context for the nearby levels: ordinary price movement can be meaningful against a relatively narrow gap to resistance. Volume was 2,005,607 shares, or 0.8 times the 20-session average of 2,444,836. The session’s lighter-than-normal turnover means the price action had less participation than usual, a qualification to the positive signal from OBV, which is rising. OBV tracks whether volume tends to accompany rising or falling prices; its direction suggests accumulation, but the latest volume does not provide strong confirmation.Key Levels & Scenarios
A move above A$42.47 resistance would clear the nearest 20-session ceiling, with the three-month high of A$42.73 another nearby reference point. A sustained break above those levels would strengthen the case that buyers are extending the trend. If the price instead retreats, the A$41.32 SMA20 is the first important trend reference; the 20-session support at A$39.46 is the deeper level to watch. A fall through support would weaken the current technical structure.Technical Verdict: BUY
JournalArta’s technical verdict is BUY, based on the share price holding above its 50-day average, the 20-day average sitting above the 50-day, and an uptrend supported by rising OBV. Two bullish signals and no bearish signals reinforce that reading, though the overbought Stochastic and below-average volume argue for caution around near-term follow-through. - Ideal Entry Range: A$41.39–A$42.04 - Exit Target: Target 1 at A$44.29; Target 2 at A$46.54 - Stop Loss: A$40.54 - Invalidation: The verdict is invalidated if the price falls below A$40.54. In plain English, the indicators favour an upward trend, but a pullback remains possible before that trend continues.Summary Data Woolworths
| Last price | 42.04 AUD |
| Change 1 day / 5 days / 1 month | -0.36% / -0.10% / 1.03% |
| Trend / MA-cross | uptrend / none |
| SMA20 / SMA50 | 41.32 / 39.92 |
| RSI (14) / Stochastic %K | 59.7 / 81.0 |
| Bollinger %B / ATR | 69% / 0.88 |
| Support / Resistance 20 days | 39.46 / 42.47 |
| Data as of | 17 November 2026 12:10 WIB |
| JournalArta research verdict (score) | Buy (+74) |
| Entry zone | 41.39 – 42.04 |
| Target 1 / 2 | 44.29 / 46.54 |
| Stop loss | 40.54 |
| Reward/risk | 1.5 / 3.0 |
Today's full Buy and Sell list for Australian stocks (ASX) →
Disclaimer: This technical analysis is generated automatically from exchange data and indicators calculated by JournalArta, for information and education only. The verdict and the entry, target and stop-loss levels are not investment advice or a solicitation to buy or sell any security. Investment decisions and their risks rest solely with the reader.
Track Woolworths share price daily: live levels, support/resistance and our full Woolworths analysis history.
 Take the quizWhat Kind of Holiday Spender Are You? Take the Black Friday QuizStart →
- 1U.S. Emergency Alert Test Nov. 17 Is Not a Power Outage

- 2DUP Chairman Lord Morrow Loses Wife and Daughter Within Hours in NI

- 3Women With Autoimmune Diseases Wait About 4 Years for Diagnosis, Study Finds

- 4NASA’s Curiosity Rover Burst Open a Rock and Found Pure Sulfur

- 5Stock Market Today: Dow Futures Slip as Nasdaq Futures Climb Before Earnings

 Lifestyle7 Signs Your Social Battery Is Running Low (and Why You Keep Cancelling Plans)
 Lifestyle · Food & HealthThanksgiving Food Safety: How Long Leftovers Last and the Safe Turkey Temperature
 Lifestyle7 Quiet Habits of Emotionally Intelligent People, According to Psychologists
 LifestylePeople Who Don’t Like Celebrating Their Birthday Often Share These 7 Traits