GE Aerospace (GE) Stock on Thursday: Slides 3.47%, Up 5.1% in Five Sessions
Technical analysis of GE stock on November 12, 2026: price 330.86 USD, trend sideways, RSI 56.9, support 285.64, resistance 342.75.

Trend & Price Action
The previous close of $342.75 is exactly the 20-day resistance. The stock reached its recent ceiling and was turned back in a single session. The latest price remains above the 20-day average of $312.65 and above the 50-day average of $314.82, so buyers still hold the structure. The trend reads as sideways, though. The 20-day average rose 2.07% over five days, but it still sits below the 50-day. A moving-average cross has not occurred, and none is new. The averages are converging rather than confirming a fresh direction. The stock sits at 79% of its 20-day range, between support at $285.64 and resistance at $342.75. The three-month range is wider, with a high of $375.58 and a low of $278.37. At $330.86, the price is roughly $45 below the quarter's peak and about $52 above its trough. The chart shows where those boundaries fall relative to price and the Bollinger bands.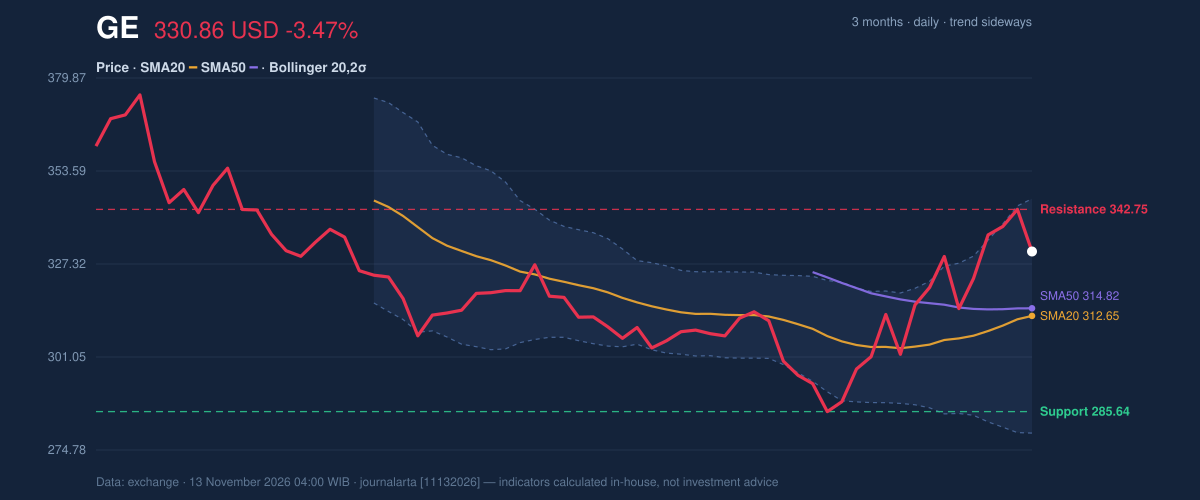
Oscillators & Momentum
Momentum indicators are mixed. The RSI, which measures the speed of recent gains against losses on a 0–100 scale, reads 56.9, a neutral zone with room in both directions. The Stochastic oscillator, which shows where the close sits within its recent range, gives a more cautious picture: %K is 78.4 against a %D of 91.3. The faster line is now below the slower one after the slower line reached overbought territory, which fits a stock that just pulled back from resistance. The MACD, a gauge of the gap between short- and long-term price averages, still leans positive. It stands at 6.222 against a signal line of 2.168, leaving a histogram of 4.055. Momentum has not broken, but the Stochastic suggests the push is cooling at the top of the range.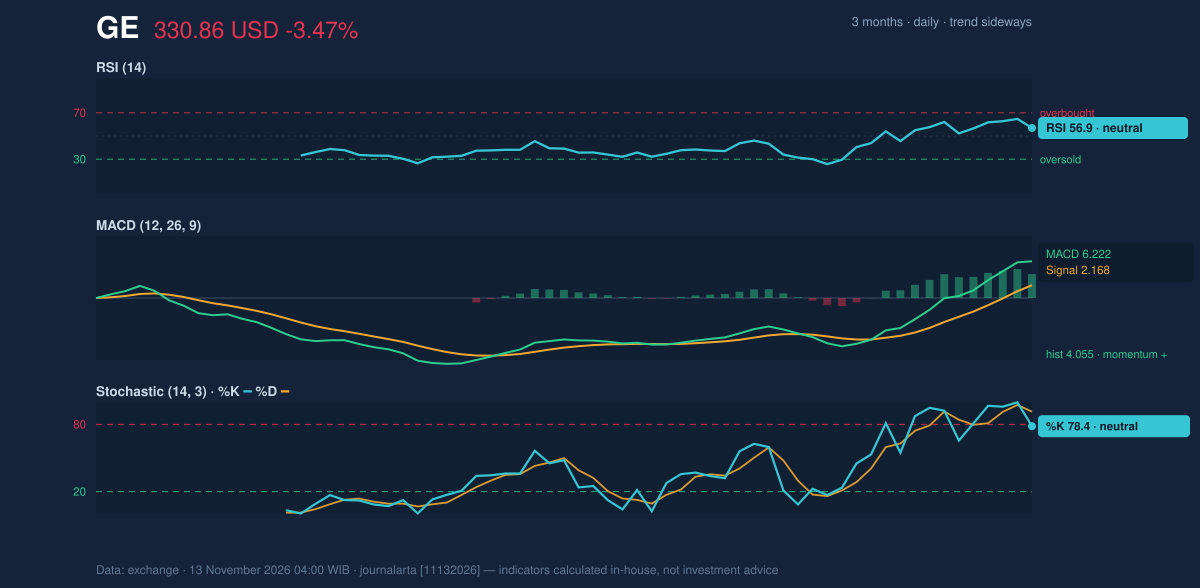
Volatility & Volume
The Bollinger bands, which draw a channel two standard deviations around the 20-day average, are widening. The upper band is $345.75, the middle $312.65 and the lower $279.56. Band width is 21.2%, and %B, which shows where price sits inside the channel, reads 78%. The stock closed in the upper part of the channel, just under the upper band, which is common after a test of resistance. The 14-day Average True Range, a measure of typical daily movement, is $11.77, or 3.6% of the price. That is high volatility. A move of one ATR is about $12, so a swing of 3.47% in one session is within normal behavior for this stock rather than an outlier. Participation was lighter on the decline. Volume was 4,549,900 shares, about 0.8 times the 20-day average of 5,653,650. On-balance volume, which tallies volume on up days against down days, is still rising. A pullback on below-average turnover with rising OBV usually reads as profit-taking rather than heavy distribution, though one session is thin evidence.Key Levels & Scenarios
Reference levels computed from the data frame the next moves. On the upside, a close above the 20-day resistance of $342.75 would put the upper Bollinger band at $345.75 and the 1.5×ATR upper marker at $348.52 in view, with the three-month high of $375.58 as the larger ceiling. On the downside, a slip back toward the 20-day average near $312.65, or the 1.5×ATR lower marker at $313.20, would test the recent advance. A break of the 20-day support at $285.64 would expose the three-month low of $278.37, close to the lower band at $279.56.Fundamental Context
According to its SEC filing, GE Aerospace reported quarterly revenue of $14.12 billion for the quarter ended September 30, 2026, up 15.9% from $12.18 billion a year earlier (Form 10-Q filed October 20). Net income was $2.29 billion, compared with $2.16 billion a year earlier, and diluted earnings per share were $2.20. Revenue growth outpaced profit growth in the period, a detail that matters for how much of the recent price strength is already reflected. The technical verdict below is driven by the chart signals, not by these filings.Technical Verdict: HOLD (wait & see)
JournalArta's research board scores GE at +20 on a −100 to +100 scale, short of the +60 Buy and −60 Sell thresholds. Trend and momentum are not aligned yet.
Why GE is in focus today
- One-day move of 0.00%, about 0.0× its average daily range (ATR)
Selected automatically from 6 NYSE (US) stocks by a technical-signal score with daily weighted randomisation — not a recommendation.
- Upside scenario: a close above the 20-day resistance at 342.75.
- Downside scenario: a break below the 20-day support at 285.64.
In plain terms: GE has no clear direction yet; 342.75 and 285.64 are the levels that decide the next move.
Summary Data GE
| Last price | 330.86 USD |
| Change 1 day / 5 days / 1 month | -3.47% / 5.13% / 6.04% |
| Trend / MA-cross | sideways / none |
| SMA20 / SMA50 | 312.65 / 314.82 |
| RSI (14) / Stochastic %K | 56.9 / 78.4 |
| Bollinger %B / ATR | 78% / 11.77 |
| Support / Resistance 20 days | 285.64 / 342.75 |
| Data as of | 13 November 2026 04:00 WIB |
| JournalArta research verdict (score) | Hold (+20) |
Today's full Buy and Sell list for US stocks →
Disclaimer: This technical analysis is generated automatically from exchange data and indicators calculated by JournalArta, for information and education only. The verdict and the entry, target and stop-loss levels are not investment advice or a solicitation to buy or sell any security. Investment decisions and their risks rest solely with the reader.
Track GE stock price daily: live levels, support/resistance and our full GE analysis history.