Merck (MRK) Stock Latest: Falls 0.16% on Thursday, Up 1.2% in a Month
Technical analysis of MRK stock on November 12, 2026: price 146.95 USD, trend uptrend, RSI 51.4, support 140.61, resistance 150.36.
By Alistair Sterling
November 13, 20265 min read
Logo Merck — JournalArta illustration
Why MRK is in focus today
Fresh golden cross: SMA20 crossed above SMA50
Not covered by JournalArta in the last 14 days
Selected automatically from 80 NYSE (US) stocks by a technical-signal score with daily weighted randomisation — not a recommendation.
Merck's 20-day moving average crossed above its 50-day average at the Thursday, November 12 close, a bullish signal that arrives just as the stock's trading range has tightened to its narrowest in weeks.
Shares in the drugmaker (NYSE: MRK) ended the session at $146.95, down 0.16% from a prior close of $147.18. That is a quiet day. The quiet stretch is the point: the stock is up 0.01% over five days and 1.21% over one month, so the cross has formed without a big price move behind it.
Advertisement
Trend & Price Action
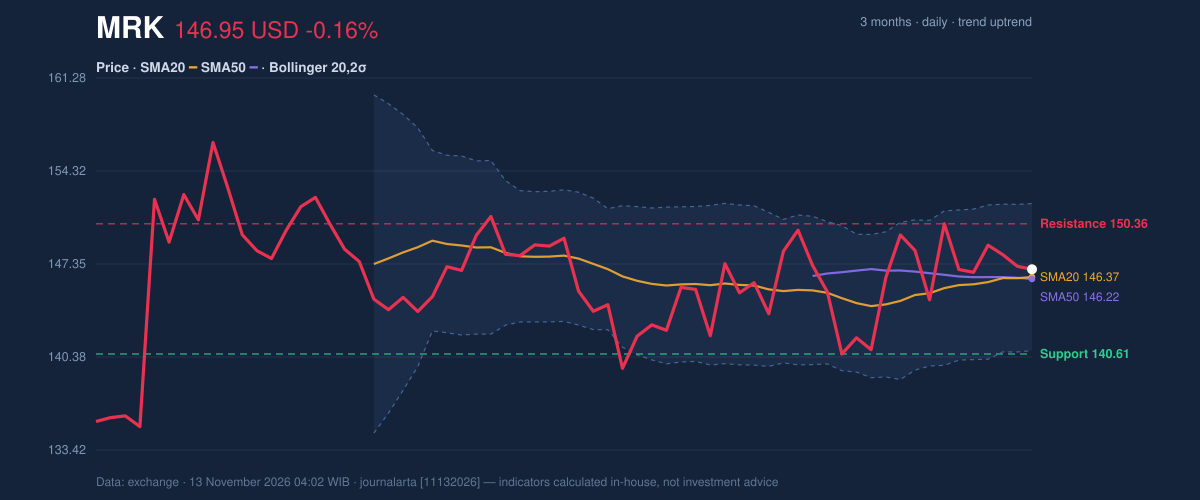
The 20-day simple average (SMA20) sits at $146.37 and the 50-day (SMA50) at $146.22. A gap of just 15 cents shows how marginal the crossover is. A "golden cross" simply means the faster, short-term average has climbed above the slower one, a sign that recent prices are running slightly ahead of the longer-term trend.
Price holds above the SMA20, and the 20-day average rose 0.41% over five days, which keeps the trend classified as an uptrend. The stock sits at 65% of its 20-day range, between support at $140.61 and resistance at $150.36. Over three months, the high is $156.92 and the low $133.06, so Merck trades well below its recent peak.
As shown in the chart, price is hugging both averages.
3-month price action chart of MRK: price, SMA20/50, Bollinger, support & resistance.
Advertisement
A cross this thin can reverse easily. Both lines are nearly flat against each other, and one weak session could pull them back together.
Oscillators & Momentum
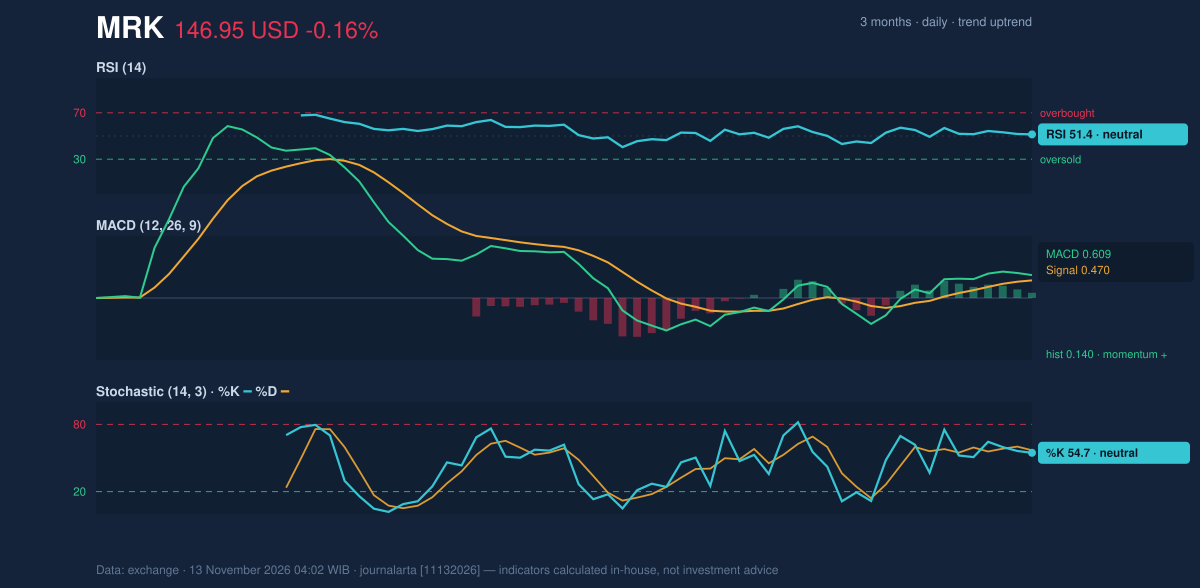
Momentum gauges are balanced rather than stretched. The 14-day Relative Strength Index (RSI), which measures whether buying or selling has been stronger recently, reads 51.4, squarely neutral. The Stochastic oscillator, which compares the close with the recent trading range, shows %K at 54.7 and %D at 56.9, also neutral.
The MACD, a trend-following gauge built from two moving averages, is more constructive. It stands at 0.609 against a signal line of 0.470, leaving a histogram of 0.140. Positive momentum with a neutral RSI means the stock has room to move without being overbought.
Momentum chart of MRK: RSI(14), MACD, Stochastic.
Advertisement
The picture: momentum is tilting up, but without conviction.
Volatility & Volume
The Bollinger Bands, which draw a channel two standard deviations around the 20-day average, run from $140.86 to $151.88, with the middle at $146.37. Price sits at 55% of the channel (%B), near the middle. The bands are only 7.5% wide and narrowing, a "squeeze" that often precedes a sharper move in either direction. The squeeze does not say which way.
The Average True Range (ATR), a measure of typical daily movement, is $4.46, or 3.0% of the price, a moderate level of volatility.
Volume is the weak link. Thursday's 6.11 million shares were only 0.6 times the 20-day average of 9.88 million, and On-Balance Volume (OBV), which tracks whether volume is flowing in on up days or down days, is falling. A breakout on thin participation is less reliable. The cross lacks volume support so far.
Advertisement
Fundamental Context
According to its SEC filing (Form 10-Q, filed November 4), Merck reported quarterly revenue of $18.09 billion for the quarter ended September 30, up 4.7% from $17.28 billion a year earlier. Net income was $5.07 billion, compared with $5.79 billion a year earlier, and diluted earnings per share were $2.04. Revenue grew while profit declined year on year, a mixed result that helps explain a stock moving sideways despite a technical turn.
Key Levels & Scenarios
If the price holds above the 20-day average near $146.37, the new cross stays intact. A move through resistance at $150.36 would put the upper Bollinger Band at $151.88 in view. If the stock falls below the $140.61 support, which sits close to the lower band at $140.86, the bullish setup weakens materially.
Advertisement
Technical Verdict: BUY
JournalArta's research model scores MRK at +76 on a scale of −100 to +100, above the +60 threshold for a BUY call. The strongest reasons:
- Golden cross: the SMA20 moved above the SMA50 at the latest session.
- Trend structure: price is above both averages, and the 20-day average is rising 0.41% over five days.
- MACD: the histogram of 0.140 shows positive momentum, and the model counts two bullish signals against none bearish, including a pullback to the SMA20 within an uptrend.
Levels set by the model:
- Entry range: $143.60 – $146.95
- Exit target 1: $158.35 (reward/risk 1.5)
- Exit target 2: $169.75 (reward/risk 3.0)
- Stop loss: $139.35
The verdict is invalidated if price falls below $139.35. The call is valid until December 11, 2026. Falling OBV and volume at 0.6 times normal are the main caution flags.
In plain terms: the chart leans positive for Merck, but the signal is fresh, thin and unproven, so the stock needs to hold above its averages to confirm it. This is technical analysis, not an investment recommendation.
Merck's next scheduled test is whether the new cross survives the next few sessions, with the 20-day average at $146.37 as the line to watch.
| Indicator | Value |
|---|---|
| Last price (Nov 12 close) | $146.95 |
| 1-day / 5-day / 1-month change | -0.16% / 0.01% / 1.21% |
| SMA20 / SMA50 | $146.37 / $146.22 |
| Bollinger (upper / mid / lower) | $151.88 / $146.37 / $140.86 |
| RSI(14) | 51.4 |
| Stochastic %K / %D | 54.7 / 56.9 |
| MACD / signal / histogram | 0.609 / 0.470 / 0.140 |
| ATR(14) | $4.46 (3.0%) |
| Support / resistance (20-day) | $140.61 / $150.36 |
| 3-month high / low | $156.92 / $133.06 |
Disclaimer: This technical analysis is generated automatically from exchange data and indicators calculated by JournalArta, for information and education only. The verdict and the entry, target and stop-loss levels are not investment advice or a solicitation to buy or sell any security. Investment decisions and their risks rest solely with the reader.