Keurig Dr Pepper (KDP) Stock Tumbles 7.40%: Trading Volume 1.9x Normal
Technical analysis of KDP stock on November 12, 2026: price 35.42 USD, trend sideways, RSI 51.7, support 34.46, resistance 38.25.
Shares of Keurig Dr Pepper (NASDAQ: KDP) fell 7.40% to $35.42 in the Nasdaq session of Thursday, November 12, 2026, from a previous close of $38.25. Volume reached 37.14 million shares, 1.9 times the 20-day average of 19.60 million. A drop that large on that much trading is rarely noise. The question is whether it broke the chart or only bent it.
Why KDP is in focus today
- One-day move of 0.00%, about 0.0× its average daily range (ATR)
- Volume at 0.0× the 20-day average
Selected automatically from 11 NASDAQ (US) stocks by a technical-signal score with daily weighted randomisation — not a recommendation.
Trend & Price Action
The previous close of $38.25 matches the stock's 20-day resistance exactly, and it sits just below the three-month high of $38.29. Buyers pushed the shares to the top of their range, and sellers turned them back in a single session.
Price now sits below the 20-day moving average at $35.70 but above the 50-day at $33.26. The 20-day average itself is still rising, up 2.94% over five days, so the longer trend has not turned. The stock is down 3.98% over five days and still up 3.63% over one month. No new moving-average crossover has formed.
As the chart shows, the stock now sits about a quarter of the way up its 20-day range, between support at $34.46 and resistance at $38.25.
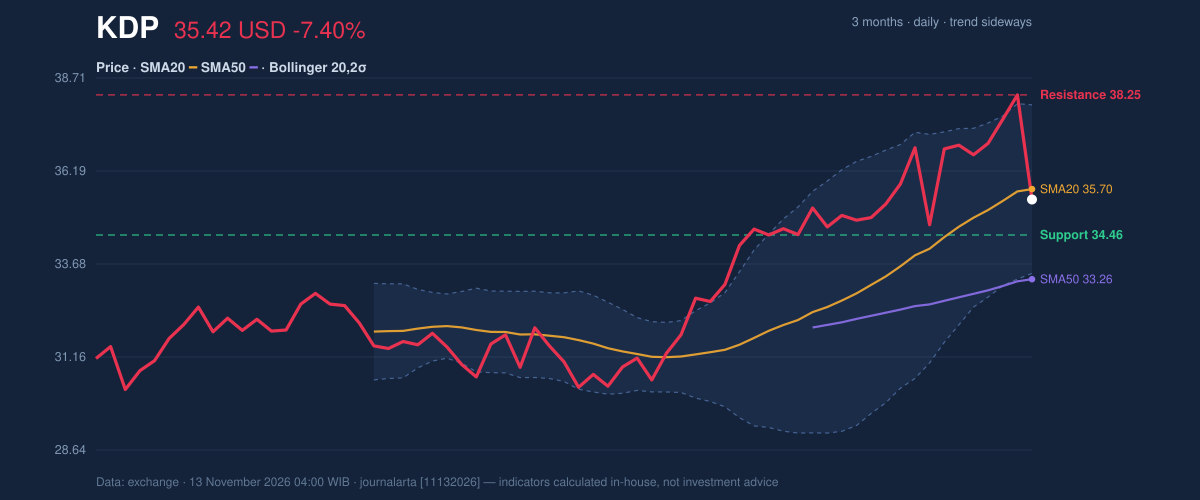
Bollinger Bands, which draw a volatility envelope around the 20-day average, put the stock inside a normal-width channel: $37.98 on top, $33.42 on the bottom, 12.8% wide. The %B reading of 44% means the price is just under the middle of that channel, so the move has not pushed it out of range. Support at $34.46 sits close to the price.
Oscillators & Momentum
The Relative Strength Index (RSI), a 0–100 gauge of how hard buyers or sellers have been pushing, reads 51.7. That is neutral, neither stretched nor washed out. A 7.40% fall left the stock in the middle of the gauge, which shows how far it had climbed in recent weeks.
The Stochastic oscillator shows the sharper change. Its fast line (%K) is at 28.4 while the slow line (%D) is at 73.0. The fast line has dropped well below the slow one, which indicates the stock closed near the low end of its recent range.
The MACD, a trend-following momentum measure, sits at 1.119 against a signal line of 1.126. The histogram is -0.006. That is barely negative, but it marks the point where momentum stopped improving.
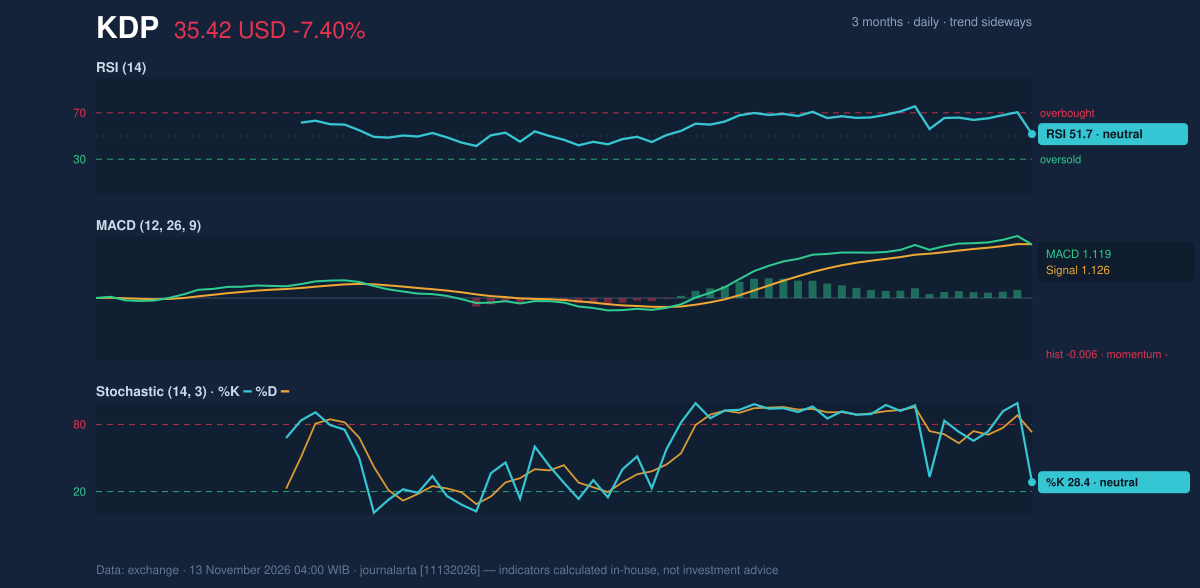
The tools disagree. The trend is intact, while the short-term momentum gauges have cooled quickly.
Volatility & Volume
The Average True Range (ATR), the typical daily swing, is $1.32, or 3.7% of the price. That is high. A stock moving this much can cover the distance between support and the 20-day average in a day or two.
Heavy volume on a down day normally signals real selling. Even so, On-Balance Volume (OBV), a running tally that adds volume on up days and subtracts it on down days, is still rising. One heavy session has not yet erased the accumulation built earlier. A second high-volume decline would test that.
Fundamental Context
According to its SEC filing, Keurig Dr Pepper reported quarterly revenue of $7.34 billion for the quarter ended September 30, 2026, up 70.6% from $4.31 billion a year earlier (Form 10-Q filed November 9). Net income was $882.0 million, compared with $662.0 million a year earlier, and diluted earnings per share were $0.59. The company also filed a Form 8-K on November 3 reporting its results of operations and financial condition. The filings do not by themselves explain Thursday's drop.
Technical Verdict: HOLD (wait & see)
JournalArta's research model scores KDP at +27 on a scale from -100 to +100. The call changes only at +60 or above, or -60 or below, so the verdict is HOLD (wait & see). Three signals drive it:
- Trend: the price is above the 50-day average and the 20-day average is above the 50-day. This is a constructive base.
- Momentum: RSI at 51.7 is neutral, the MACD histogram has just turned negative, and RSI has rolled over from above 65. Technical signals count 1 bullish (a pullback to the 20-day average within an uptrend) against 2 bearish.
- Volume: trading at 1.9 times average on a down day shows sellers are active.
The levels below are conditional scenarios built only from the reference levels:
- Entry range: $34.46–$35.70, from 20-day support up to the 20-day average, if the price holds the lower edge.
- Exit target: $37.39 (price plus 1.5 times ATR), then the 20-day resistance at $38.25. An upside scenario needs a close above $38.25, just under the three-month high of $38.29.
- Stop loss: below $33.45 (price minus 1.5 times ATR), which lines up with the lower Bollinger Band at $33.42.
The verdict is invalidated if the price breaks below the $34.46 support. The 50-day average at $33.26 and the three-month low of $30.01 would then come into view.
In plain terms: KDP took a hard hit from the top of its range, but its longer trend is still intact, so the chart says to wait for the next move rather than act on this one.
Summary Data KDP
| Last price | 35.42 USD |
| Change 1 day / 5 days / 1 month | -7.40% / -3.98% / 3.63% |
| Trend / MA-cross | sideways / none |
| SMA20 / SMA50 | 35.70 / 33.26 |
| RSI (14) / Stochastic %K | 51.7 / 28.4 |
| Bollinger %B / ATR | 44% / 1.32 |
| Support / Resistance 20 days | 34.46 / 38.25 |
| Data as of | 13 November 2026 04:00 WIB |
| JournalArta research verdict (score) | Hold (+27) |
Today's full Buy and Sell list for US stocks →
Disclaimer: This technical analysis is generated automatically from exchange data and indicators calculated by JournalArta, for information and education only. The verdict and the entry, target and stop-loss levels are not investment advice or a solicitation to buy or sell any security. Investment decisions and their risks rest solely with the reader.
Track KDP stock price daily: live levels, support/resistance and our full KDP analysis history.