Kraft Heinz (KHC) Stock on Thursday: Rises 0.87%, Down 3.3% in Five Sessions
Technical analysis of KHC stock on November 12, 2026: price 24.48 USD, trend uptrend, RSI 53.1, support 23.17, resistance 25.44.
Kraft Heinz shares closed at $24.48 on Thursday, November 12, 2026, up 0.87% on the day from a previous close of $24.27. The gain looks modest, but it arrived on heavy trading: 19.06 million shares changed hands, about 1.4 times the 20-day average of 13.38 million. A recently formed golden cross, a pullback to a key moving average and rising on-balance volume give the packaged-food maker a constructive technical setup, even as the stock sits 3.32% lower over five days.
Why KHC is in focus today
Selected automatically from 11 NASDAQ (US) stocks by a technical-signal score with daily weighted randomisation — not a recommendation.
Trend & Price Action
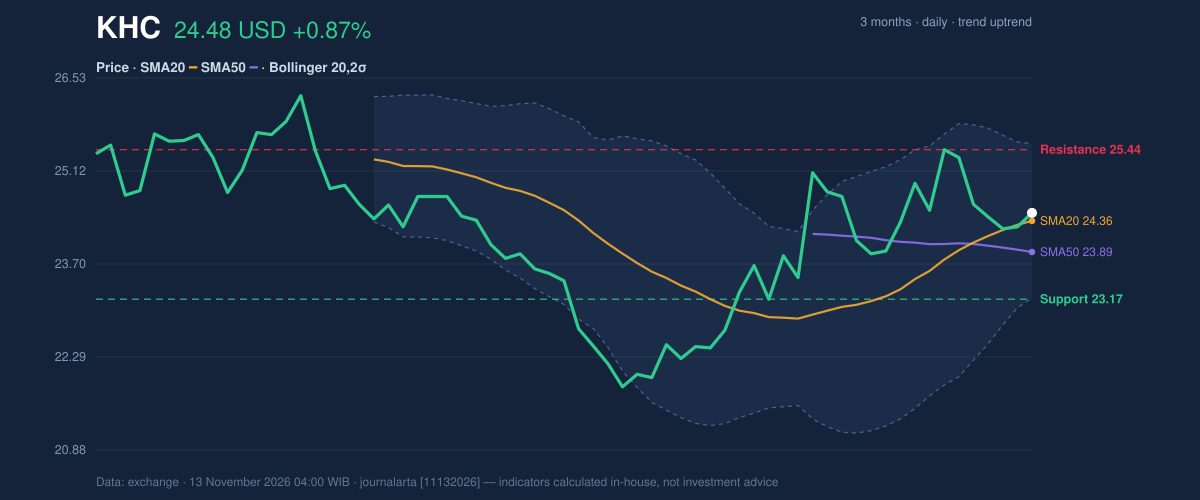
The trend is up. The shares trade above both the 20-day simple moving average (SMA20) at $24.36 and the 50-day average (SMA50) at $23.89. The 20-day average rose 1.86% over five days, which shows the recent buying has been steady rather than a one-day spike. Over one month the stock has gained 5.15%.
The 20-day average crossed above the 50-day four sessions before the latest session. Traders call this a golden cross. It means short-term prices have been rising faster than the longer-term trend, and it is often read as a sign that momentum is shifting toward buyers. It is a lagging signal, though, and it tends to be more reliable when volume supports it. Here, volume does.
Price is pressed right against the SMA20, which has acted as a floor in this uptrend. Pullbacks to a rising average that hold are the pattern analysts look for when judging whether an advance is healthy. As shown in the chart below, the stock sits at 58% of its 20-day range, between support at $23.17 and resistance at $25.44. The three-month range runs from a low of $21.76 to a high of $26.44, so the shares are in the upper half of where they have traded since late summer.
Oscillators & Momentum
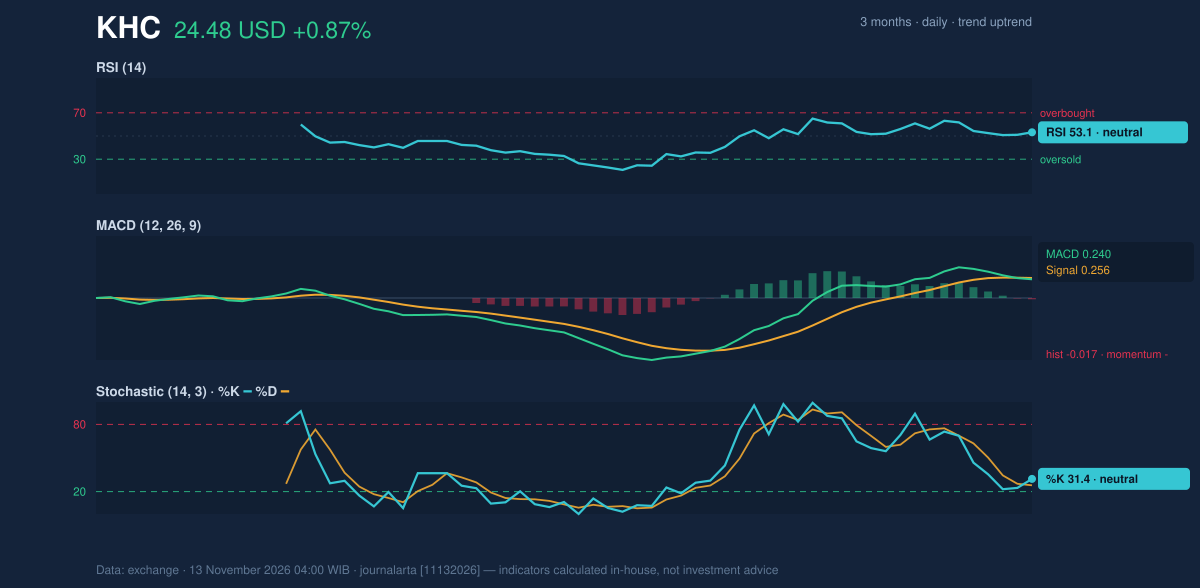
Momentum indicators are mixed, and that mix matters. The 14-day Relative Strength Index (RSI) stands at 53.1, neutral territory. RSI measures the pace of recent gains against losses on a 0–100 scale. A reading near the middle means neither buyers nor sellers are stretched, which leaves room for movement in either direction.
The Stochastic oscillator is lower, with %K at 31.4 and %D at 25.6. This indicator compares the closing price with the recent trading range. Readings in this zone say the stock has been closing in the lower part of its recent range, consistent with the five-day slide, and it is approaching the oversold area below 20 without reaching it.
The weaker signal comes from the Moving Average Convergence Divergence (MACD) indicator. The MACD line is 0.240 against a signal line of 0.256, leaving a histogram of -0.017. The histogram has just turned negative, which flags fading short-term momentum. The gap is tiny, so this reads as a pause rather than a reversal, but it is the main counterweight to the bullish case.
Volatility & Volume
Bollinger Bands, which draw a channel two standard deviations around the 20-day average, span $23.19 to $25.53. Price sits at 55% of that channel (%B), essentially at the midline, and the band width of 9.6% is normal. There is no squeeze that would hint at an imminent breakout, nor an expansion that would signal stress.
The 14-day Average True Range (ATR) is 0.71, or 2.9% of the price. That points to moderate volatility: a typical daily swing is roughly 71 cents. It also gives context for the stop level discussed below, which sits a little over two ATRs from the current price.
Volume is the most encouraging piece. Thursday's turnover ran 1.4 times normal, and on-balance volume, which adds volume on up days and subtracts it on down days, is rising. That suggests participation is building behind the advance rather than draining away, which supports the golden cross.
Fundamental Context
According to its SEC filing, Kraft Heinz reported quarterly revenue of $6.12 billion for the quarter ended September 26, 2026, down 2.0% from $6.24 billion a year earlier (Form 10-Q filed November 4). Net income was $544.0 million, compared with $615.0 million a year earlier, and diluted earnings per share were $0.46. The company also filed Form 8-Ks on November 4, reporting a change of directors or officers and a Regulation FD disclosure, and on November 12, reporting a further Regulation FD disclosure. Shrinking sales and profit explain why the stock's rally has been measured; the technical picture reflects the market's response to those results.
Key Levels & Scenarios
Support at $23.17 and the lower Bollinger band at $23.19 form a tight floor. Resistance at $25.44, close to the upper band at $25.53, caps the near-term range. A sustained move above that zone would put the three-month high of $26.44 in view; a close below the SMA50 near $23.89 would weaken the pullback-in-an-uptrend reading.
Technical Verdict: BUY
JournalArta's research model rates KHC BUY with a score of +66 on a scale of −100 to +100, where +60 or above qualifies. The three strongest reasons:
- Fresh golden cross: the SMA20 crossed above the SMA50 four sessions before the latest session.
- Pullback within an uptrend: price is at the SMA20 and above the SMA50, with the 20-day average rising 1.86% over five days.
- Volume confirmation: on-balance volume is rising and Thursday's volume was 1.4 times its 20-day average.
The counter-signal is the MACD histogram at -0.017, which has just turned negative. The levels computed for this call, valid until December 11, 2026:
- Entry range: $23.95 – $24.48
- Exit target 1: $26.67 (reward/risk 1.5)
- Exit target 2: $28.86 (reward/risk 3.0)
- Stop loss: $23.02
The verdict is invalidated if the price falls below $23.02.
In plain terms: the charts show a stock that has been climbing and is catching its breath, and the indicators lean toward that climb continuing, though a drop under $23.02 would say otherwise. This is technical analysis, not an investment recommendation.
Kraft Heinz's latest regulatory filing, a Regulation FD disclosure on Form 8-K, was lodged with the SEC on November 12.
Summary Data KHC
| Last price | 24.48 USD |
| Change 1 day / 5 days / 1 month | 0.87% / -3.32% / 5.15% |
| Trend / MA-cross | uptrend / golden |
| SMA20 / SMA50 | 24.36 / 23.89 |
| RSI (14) / Stochastic %K | 53.1 / 31.4 |
| Bollinger %B / ATR | 55% / 0.71 |
| Support / Resistance 20 days | 23.17 / 25.44 |
| Data as of | 13 November 2026 04:00 WIB |
| JournalArta research verdict (score) | Buy (+66) |
| Entry zone | 23.95 – 24.48 |
| Target 1 / 2 | 26.67 / 28.86 |
| Stop loss | 23.02 |
| Reward/risk | 1.5 / 3.0 |
Today's full Buy and Sell list for US stocks →
Disclaimer: This technical analysis is generated automatically from exchange data and indicators calculated by JournalArta, for information and education only. The verdict and the entry, target and stop-loss levels are not investment advice or a solicitation to buy or sell any security. Investment decisions and their risks rest solely with the reader.
Track KHC stock price daily: live levels, support/resistance and our full KHC analysis history.