Progressive (PGR) Stock on Thursday: Rises 0.84%, Up 10.2% in a Month
Technical analysis of PGR stock on November 12, 2026: price 235.49 USD, trend uptrend, RSI 62.6, support 218.49, resistance 235.49.
Progressive Corp. closed at $235.49 on the New York Stock Exchange on Thursday, November 12, 2026, up 0.84% on the day from a prior close of $233.53. The insurer has gained 0.99% over five days and 10.17% over one month, and the latest close sits exactly at its 20-day resistance. Three bullish technical signals and no bearish ones, as computed by JournalArta's screening code, put it on today's watch list.
Why PGR is in focus today
Selected automatically from 6 NYSE (US) stocks by a technical-signal score with daily weighted randomisation — not a recommendation.
A stock that has risen about a tenth in a month, and is now pressed against the top of its recent range, raises a simple question: is the move still building, or is it tiring? The indicators lean toward the former, with caveats.
Trend & Price Action
The structure is a clean uptrend. The shares trade above both the 20-day simple moving average (SMA20) at $228.38 and the 50-day average (SMA50) at $219.75. The 20-day average itself rose 1.52% over five days. That figure describes the average's slope, not the share price, but it shows the recent trading range is climbing, not just spiking.
The SMA20 sits above the SMA50, and there is no new crossover. That means the bullish alignment is established rather than fresh. Traders usually read it as a trend with some age, not a just-triggered signal.
The three-month range runs from a low of $200.96 to a high of $241.02. At $235.49, the stock is in the upper reach of that band, about $5.53 below the three-month high.
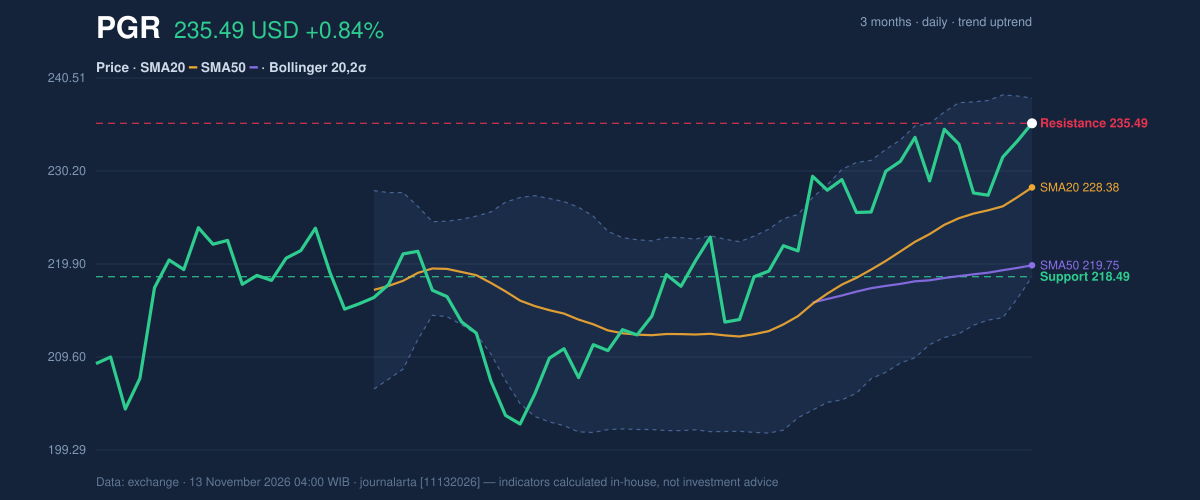
As the chart shows, price has pushed through the middle of its Bollinger bands and now hugs the upper edge. Bollinger %B is 86%, meaning the close sits close to the upper band at $238.27. The bands are 8.7% wide, a normal reading, so this is neither a squeeze nor a blow-off expansion. A close this near the upper band can signal strength, but it also leaves less room before the stock tests a ceiling.
Oscillators & Momentum
Momentum supports the trend without flashing excess. The RSI(14) is 62.6, classified neutral. The relative strength index measures how strongly recent gains outweigh recent losses on a 0–100 scale; readings above 70 are typically called overbought. At 62.6, buyers hold the upper hand with room to spare.
The Stochastic %K is 67.8 against %D at 58.1, also neutral. With the faster line above the slower one, short-term momentum is pointing up, though not stretched.
The MACD is the most telling signal. The line reads 4.083 against a signal line of 4.002, a histogram of just 0.081. The histogram has only just turned positive. Put simply, upward momentum is resuming after a pause, though by a thin margin.
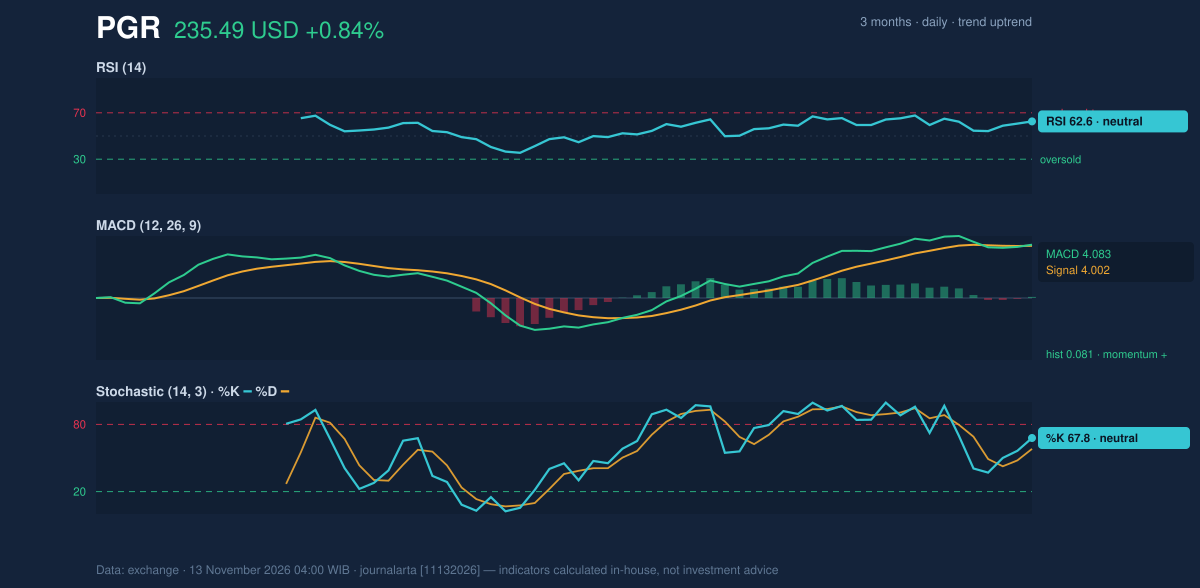
Taken together, the three oscillators agree with the price trend and none shows a divergence. That is the main reason the setup reads as continuation, not exhaustion.
Volatility & Volume
The Average True Range, a gauge of typical daily movement, is $5.05, or 2.1% of the price. That is moderate volatility. A daily swing of that size is large enough to cover the distance between the stock's current level and its nearest levels in a session or two.
Participation is the soft spot. Thursday's volume of 2,083,700 shares was about 0.9 times the 20-day average of 2,394,830, a slightly thin session. Yet the on-balance volume (OBV) line, which adds volume on up days and subtracts it on down days, is rising. Cumulative buying pressure is still outweighing selling even though the latest day lacked conviction. A breakout through resistance on weak volume would deserve more scrutiny than one on heavy volume.
Fundamental Context
According to its SEC filing, Progressive reported quarterly revenue of $23.19 billion for the quarter ended September 30, 2026, up 3.0% from $22.51 billion a year earlier (Form 10-Q filed November 2). Net income was $2.54 billion, compared with $2.62 billion a year earlier, and diluted earnings per share were $4.37. Revenue grew while profit slipped slightly, so the share price rise has come alongside a mixed earnings picture rather than a clear profit acceleration.
Key Levels & Scenarios
Immediate resistance is $235.49, where the stock closed, with the Bollinger upper band at $238.27 and the three-month high at $241.02 above it. Support starts at the SMA20 near $228.38, then the 20-day support and lower band at $218.49, close to the SMA50 at $219.75.
The scenarios are conditional. If the stock holds above $235.49 and volume recovers toward its 20-day average, the path toward the upper band and the three-month high stays open. If it slips back under the SMA20 at $228.38, the pullback would test the lower levels instead.
Technical Verdict: BUY
JournalArta's research model scores PGR at +84 on a −100 to +100 scale, where +60 or above qualifies as a buy call. The verdict is BUY, valid until December 11, 2026. The strongest reasons:
- MACD: the histogram has just turned positive (0.081), signalling momentum resuming.
- Trend structure: price is above the SMA50, and the SMA20 is above the SMA50, in an uptrend.
- OBV: rising on-balance volume confirms the uptrend despite Thursday's lighter volume.
The verdict would be invalidated if the price falls below the stop-loss level of $226.88. Levels computed by the model:
- Entry range: $231.70 – $235.49
- Exit target 1: $248.40 (reward/risk 1.5)
- Exit target 2: $261.32 (reward/risk 3.0)
- Stop loss: $226.88
In plain terms, the technical picture for Progressive is positive, with price, momentum and volume trends pointing the same way. This is technical analysis, not an investment recommendation.
The model's verdict window runs until December 11, 2026.
Summary Data PGR
| Last price | 235.49 USD |
| Change 1 day / 5 days / 1 month | 0.84% / 0.99% / 10.17% |
| Trend / MA-cross | uptrend / none |
| SMA20 / SMA50 | 228.38 / 219.75 |
| RSI (14) / Stochastic %K | 62.6 / 67.8 |
| Bollinger %B / ATR | 86% / 5.05 |
| Support / Resistance 20 days | 218.49 / 235.49 |
| Data as of | 13 November 2026 04:00 WIB |
| JournalArta research verdict (score) | Buy (+84) |
| Entry zone | 231.70 – 235.49 |
| Target 1 / 2 | 248.40 / 261.32 |
| Stop loss | 226.88 |
| Reward/risk | 1.5 / 3.0 |
Today's full Buy and Sell list for US stocks →
Disclaimer: This technical analysis is generated automatically from exchange data and indicators calculated by JournalArta, for information and education only. The verdict and the entry, target and stop-loss levels are not investment advice or a solicitation to buy or sell any security. Investment decisions and their risks rest solely with the reader.
Track PGR stock price daily: live levels, support/resistance and our full PGR analysis history.