Advanced Micro Devices (AMD) Stock Jumps 5.86%: Trading Volume 1.7x Normal
Technical analysis of AMD stock on November 12, 2026: price 585.30 USD, trend sideways, RSI 57.5, support 404.40, resistance 585.30.
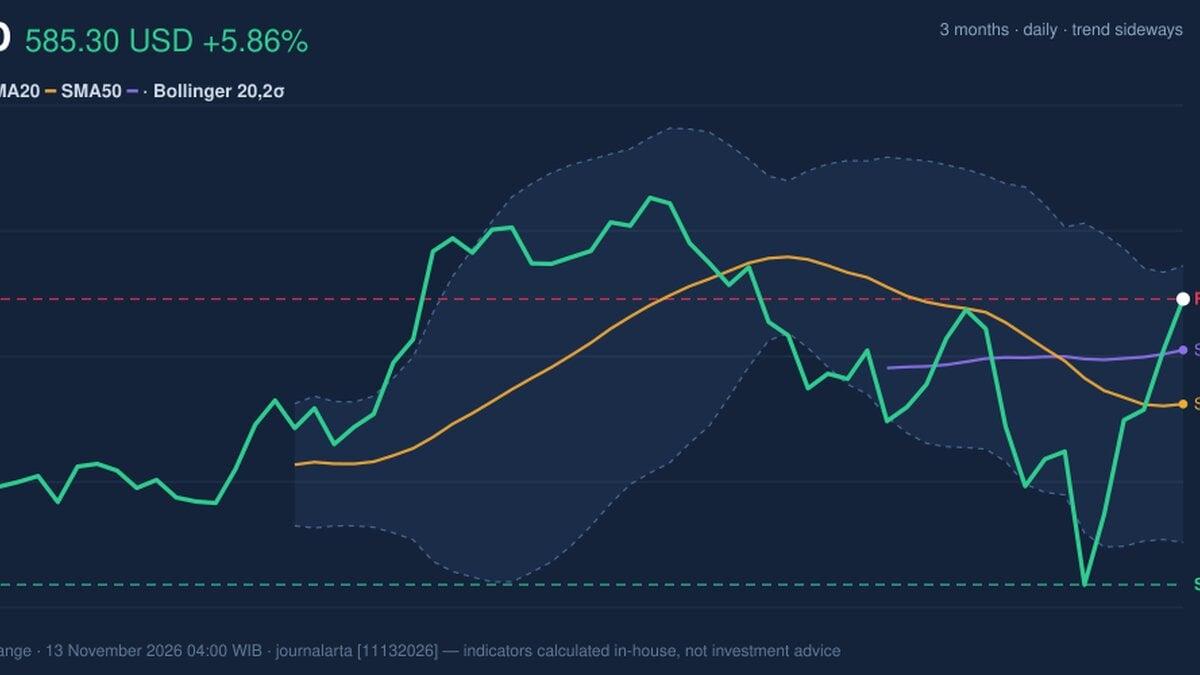
AMD is one of the most closely watched chip stocks in the world, so a jump this size matters well beyond Nasdaq. On Thursday, November 12, 2026, Advanced Micro Devices closed at $585.30, up 5.86% from $552.90 the session before. That extends a 44.73% gain over five days, though the stock is up only 4.10% over one month. The market is reading the sharp rebound as the start of something, while the trend indicators are not yet convinced.
Why AMD is in focus today
- One-day move of 0.00%, about 0.0× its average daily range (ATR)
- Volume at 0.0× the 20-day average
Selected automatically from 11 NASDAQ (US) stocks by a technical-signal score with daily weighted randomisation — not a recommendation.
Trend & Price Action
The price sits above its 20-day moving average (SMA20) of 518.76 and above the 50-day average (SMA50) of 552.99. The chart label still reads sideways, and the reason is the averages themselves. The 20-day average is below the 50-day, and it fell 3.08% over five days. Both averages are still catching up with a price that moved much faster than they did. No new moving-average crossover has formed.
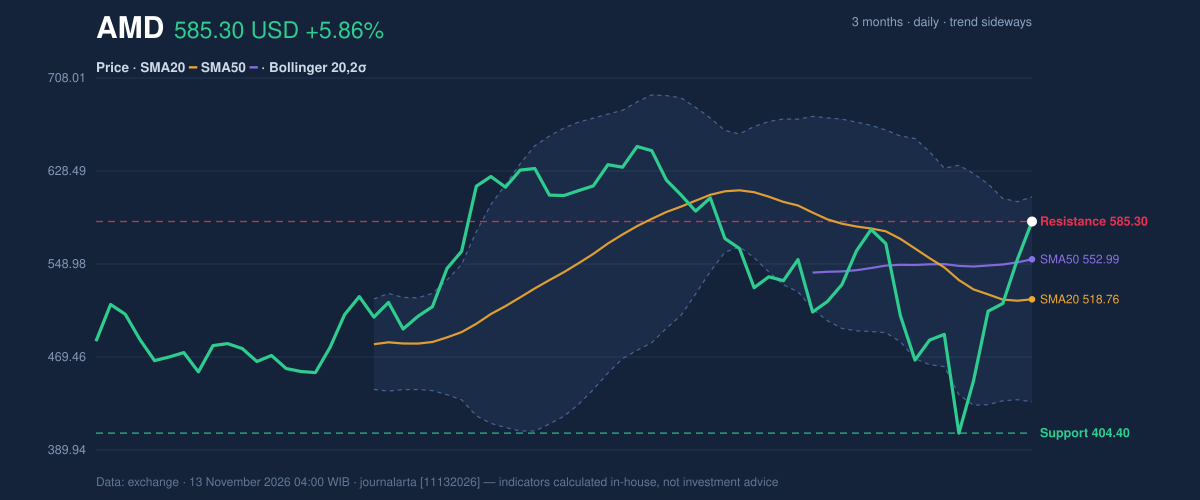
As the chart shows, the close at 585.30 sits exactly on the 20-day resistance, which puts the price at 100% of its 20-day range. The 3-month high is 658.52 and the 3-month low is 402.10, so the stock has recovered a large part of the swing but remains below the top of it. Support over 20 days is at 404.40, far below the current price. That gap shows how much of the move happened in a few sessions.
Oscillators & Momentum
Momentum indicators are split. The 14-day RSI (Relative Strength Index, a 0-100 gauge of how stretched a move is) reads 57.5, neutral. The Stochastic oscillator, which compares the close with the recent trading range, is more stretched: %K at 95.5 and %D at 81.5, both in overbought territory. A reading like that means the price is near the top of its recent range. It signals strength, but it also leaves little room before a pause.
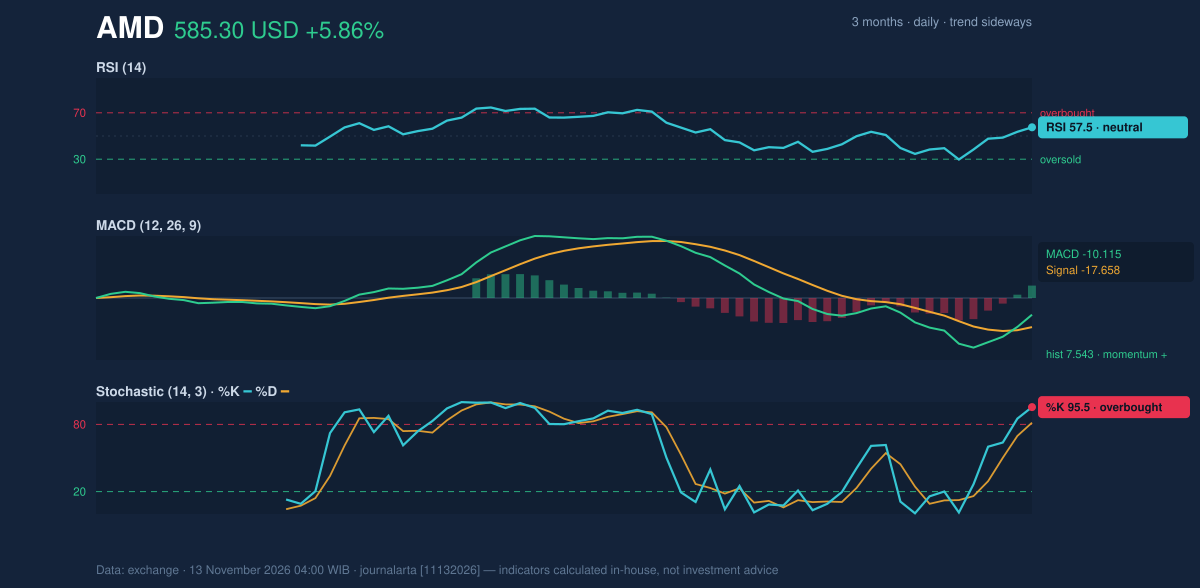
MACD, which measures the gap between short- and long-term momentum, is still negative at -10.115 against a signal line of -17.658. The histogram of 7.543 is positive, though, meaning the line has moved above its signal. Together these point to momentum turning up from a weak base rather than a trend already established. JournalArta's code counts three bullish signals and none bearish: an RSI rebound from below 35, a close above the 20-day high on volume at least 1.5 times average, and a MACD histogram that has just turned positive.
Volatility & Volume
Bollinger Bands, which mark two standard deviations around the 20-day average, are wide. The upper band is at 606.35, the middle at 518.76 and the lower at 431.16. The width is 33.8% and expanding, and the price sits at 88% of the band (%B). The 14-day ATR (Average True Range, the typical daily swing) is 44.61, or 7.6% of the price. A stock that routinely moves that much in a day can reverse as sharply as it rose.
Volume supports the rally. Thursday's turnover of 55,161,000 shares was 1.7 times the 20-day average of 33,339,710, and on-balance volume (OBV, a running tally of volume on up and down days) is rising. Heavy trading on a rise suggests real participation rather than a thin-market squeeze.
Fundamental Context
According to its SEC filing, AMD reported quarterly revenue of $13.38 billion for the quarter ended September 26, 2026, up 44.7% from $9.25 billion a year earlier (Form 10-Q filed November 4). Net income was $2.43 billion, against $1.24 billion a year earlier, and diluted earnings per share were $1.46. The business results are strong, but this article's verdict rests on the price signals.
Technical Verdict: HOLD (wait & see)
JournalArta's research score is +49 on a scale of -100 to +100. A buy call needs +60 or above and a sell call -60 or below, so the call is HOLD (wait & see). The strongest reasons:
- Trend and momentum are not aligned: the price is above both averages, but the 20-day average is still below the 50-day and falling.
- Stochastic is overbought at 95.5, and the price is pressed against 20-day resistance at 585.30.
- Volume confirms the move: 1.7 times average on an up day, with OBV rising.
The levels below are conditional scenarios drawn only from the reference levels:
- Upside scenario: entry range only after a close above 585.30; target 652.22 (price plus 1.5 ATR), just under the 3-month high of 658.52; stop loss 518.38 (price minus 1.5 ATR).
- Downside scenario: a break below the 20-day support at 404.40 would open the way toward the 3-month low of 402.10, which would invalidate any constructive reading.
The constructive view is also invalidated if the price falls back below the 20-day average of 518.76. This is technical analysis, not an investment recommendation.
In plain terms: AMD has bounced hard and trading volume backs it, but the longer-term trend has not yet confirmed the move, so the chart says to wait for a clearer break either way.
Summary Data AMD
| Last price | 585.30 USD |
| Change 1 day / 5 days / 1 month | 5.86% / 44.73% / 4.10% |
| Trend / MA-cross | sideways / none |
| SMA20 / SMA50 | 518.76 / 552.99 |
| RSI (14) / Stochastic %K | 57.5 / 95.5 |
| Bollinger %B / ATR | 88% / 44.61 |
| Support / Resistance 20 days | 404.40 / 585.30 |
| Data as of | 13 November 2026 04:00 WIB |
| JournalArta research verdict (score) | Hold (+49) |
Today's full Buy and Sell list for US stocks →
Disclaimer: This technical analysis is generated automatically from exchange data and indicators calculated by JournalArta, for information and education only. The verdict and the entry, target and stop-loss levels are not investment advice or a solicitation to buy or sell any security. Investment decisions and their risks rest solely with the reader.
Track AMD stock price daily: live levels, support/resistance and our full AMD analysis history.