Broadcom (AVGO) Stock Latest: Jumps 5.54% on Thursday, Trading Volume 1.6x Normal
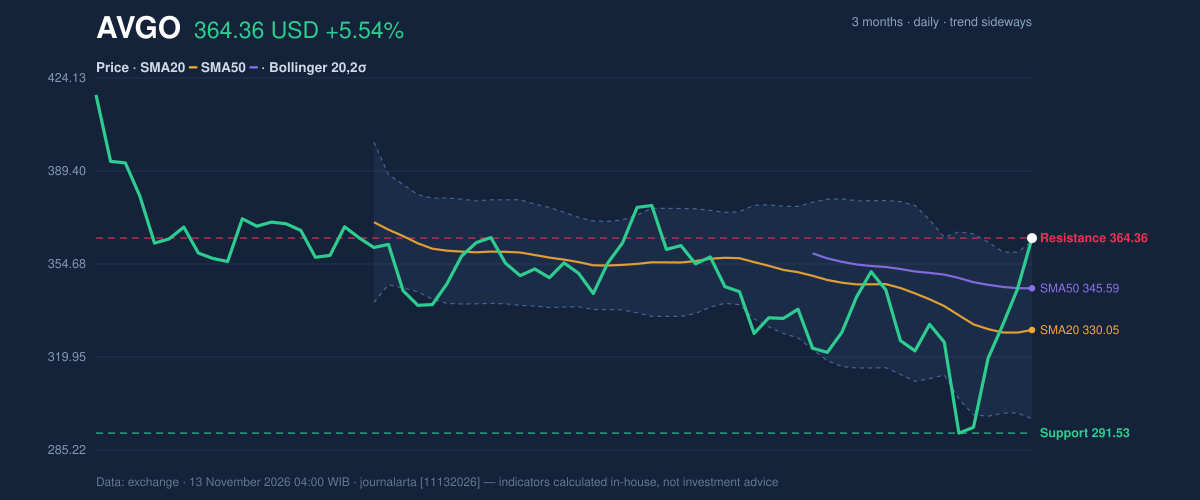
Technical analysis of AVGO stock on November 12, 2026: price 364.36 USD, trend sideways, RSI 59.2, support 291.53, resistance 364.36.
Broadcom is one of the main suppliers of the chips and networking gear behind artificial-intelligence data centres, so its share price is watched well beyond Wall Street. AVGO closed Thursday's Nasdaq session (November 12, 2026) at $364.36, up 5.54% on the day from a $345.22 close, on volume running 1.6 times its 20-day average.
Why AVGO is in focus today
- One-day move of 0.00%, about 0.0× its average daily range (ATR)
- Volume at 0.0× the 20-day average
Selected automatically from 11 NASDAQ (US) stocks by a technical-signal score with daily weighted randomisation — not a recommendation.
The jump comes after a sharp short-term run. The stock is up 24.98% over five days but only 5.82% over one month, so most of the month's gain arrived within a single week. The question for the chart is whether that burst is the start of a new trend or a stretch that needs to cool.
Trend & Price Action
The picture is mixed. AVGO trades above its 20-day average of $330.05 and above its 50-day average of $345.59. But the 20-day average still sits below the 50-day, and there has been no new moving-average crossover. The 20-day average itself slipped 1.63% over the past five days. In short, the price has moved faster than the averages that measure the trend, which is why the trend reads as sideways.
The close of $364.36 is exactly the 20-day resistance level, which means the stock finished at the top of its 20-day range. Against the wider three-month range of $289.77 to $424.92, AVGO is still well below its high. As shown in the chart below, the price has pushed up through the middle of its range and now sits against the upper edge of its Bollinger Bands.
Oscillators & Momentum
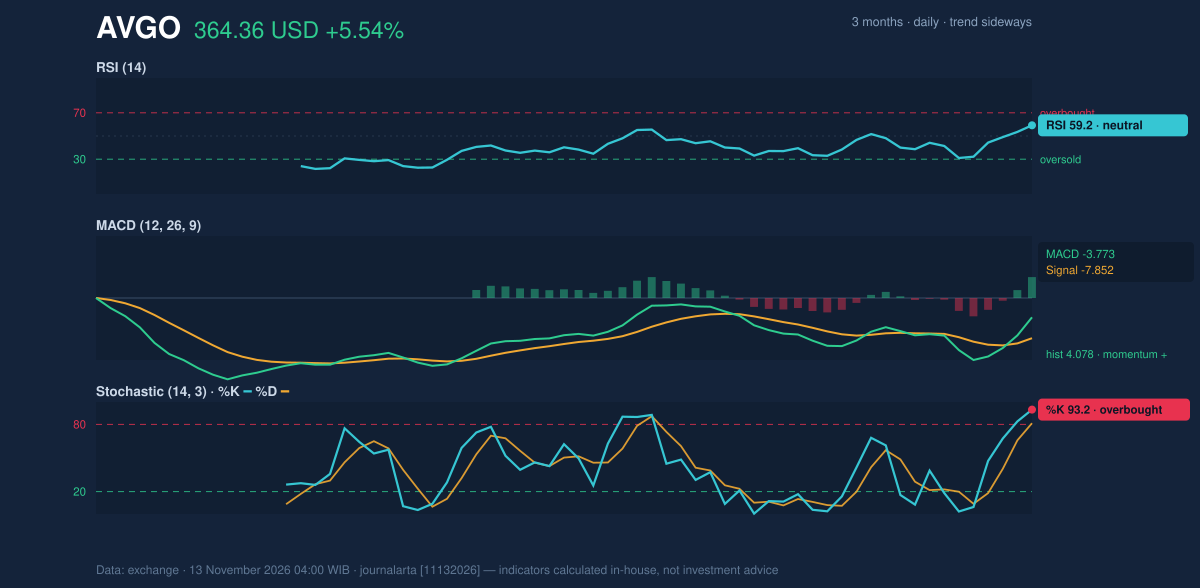
Momentum indicators give a split reading. The 14-day Relative Strength Index (RSI), which measures how strongly buyers have outpaced sellers recently, is 59.2, a neutral reading. After a near-25% weekly gain, that is not stretched, and it suggests the rally has not yet used up its momentum.
The Stochastic oscillator is more cautious. Its %K line is at 93.2 and %D at 81.1, both in overbought territory. This indicator compares the close with the recent trading range, and a reading this high simply confirms the stock is closing near the top of that range. Overbought readings can persist during strong moves, but they also leave less room for a further quick advance.
The MACD, which tracks the gap between short- and long-term averages, is still negative at -3.773, below its signal line of -7.852. The histogram, which shows the gap between those two lines, is +4.078, a positive momentum reading. The line is climbing toward zero but has not crossed it. Technical signals computed by code flag the MACD histogram turning positive and a close above the 20-day high on volume at least 1.5 times average as the bullish developments. No bearish signals were flagged.
Volatility & Volume
The Bollinger Bands show how unusual the move is. The upper band stands at $363.20, and the close of $364.36 sits just outside it, a %B reading of 102%. A close outside the band means the price has moved more than two standard deviations from its 20-day average. The bands are also widening, with their width at 20.1%, which signals volatility is rising rather than fading.
The Average True Range (ATR), a measure of typical daily movement, is 19.09. That is 5.2% of the share price, a high figure. For anyone sizing up risk, it means daily swings of this scale are normal for the stock right now, not exceptional.
Participation backs the move. Volume of 43,622,200 shares compared with a 20-day average of 26,753,915, and On-Balance Volume (OBV) is rising. Rising OBV means volume on up days has outweighed volume on down days. A breakout on heavy trading is more credible than one on thin trading, though one session cannot prove it will hold.
Fundamental Context
The price action follows strong reported results. According to its SEC filing, Broadcom posted quarterly revenue of $29.59 billion for the quarter ended August 2, 2026, up 85.5% from $15.95 billion a year earlier (Form 10-Q filed September 10, 2026). Net income was $13.09 billion, against $4.14 billion a year earlier, with diluted earnings per share of $2.68. Those figures show a company growing fast, but they do not by themselves say whether the current price already reflects that growth.
Key Levels & Scenarios
The reference levels in the data frame the next move. Resistance sits at $364.36, the 20-day high and the level the stock just closed on. The next marker above is the three-month high of $424.92. Below, the 20-day average at $330.05 and 20-day support at $291.53 mark where a pullback would be tested. The three-month low is $289.77.
Technical Verdict: HOLD (wait & see)
JournalArta's research model scores AVGO at +49 on a scale of -100 to +100. The threshold for a positive call is +60 or above, so the stock falls short of it. HOLD (wait & see) reflects that trend and momentum are not yet aligned.
- Trend not confirmed: the 20-day average is still below the 50-day average, and the 20-day average slipped 1.63% over five days despite the rally.
- Stretched short term: Stochastic %K at 93.2 is overbought, and the close is outside the upper Bollinger Band.
- Supportive volume: volume at 1.6 times average and rising OBV favour the upside, which keeps the verdict from turning negative.
Conditional scenarios from the reference levels:
- Entry range: an upside scenario opens only if the price closes above 20-day resistance at $364.36; a pullback scenario would look toward the $335.73 area (price minus 1.5 times ATR).
- Exit target (target price): $392.99 (price plus 1.5 times ATR), with the three-month high of $424.92 as the wider marker.
- Stop loss: a close below 20-day support at $291.53 would invalidate the verdict.
In plain terms, Broadcom has had a big, high-volume week, but the longer-term trend lines have not caught up, so the chart says to watch rather than act.
Summary Data AVGO
| Last price | 364.36 USD |
| Change 1 day / 5 days / 1 month | 5.54% / 24.98% / 5.82% |
| Trend / MA-cross | sideways / none |
| SMA20 / SMA50 | 330.05 / 345.59 |
| RSI (14) / Stochastic %K | 59.2 / 93.2 |
| Bollinger %B / ATR | 102% / 19.09 |
| Support / Resistance 20 days | 291.53 / 364.36 |
| Data as of | 13 November 2026 04:00 WIB |
| JournalArta research verdict (score) | Hold (+49) |
Today's full Buy and Sell list for US stocks →
Disclaimer: This technical analysis is generated automatically from exchange data and indicators calculated by JournalArta, for information and education only. The verdict and the entry, target and stop-loss levels are not investment advice or a solicitation to buy or sell any security. Investment decisions and their risks rest solely with the reader.
Track AVGO stock price daily: live levels, support/resistance and our full AVGO analysis history.