DoorDash (DASH) Stock Slides 3.19%: Down 10.6% in a Month
Technical analysis of DASH stock on November 12, 2026: price 172.58 USD, trend downtrend, RSI 41.7, support 168.44, resistance 198.59.
DoorDash (NASDAQ: DASH) closed at $172.58 on Thursday, November 12, 2026, down from a previous close of $178.26, according to exchange data. That is a 3.19% fall in one session. It leaves the stock down 4.08% over five days and 10.60% over one month, and the indicators suggest sellers still control the direction.
Why DASH is in focus today
- One-day move of 0.00%, about 0.0× its average daily range (ATR)
Selected automatically from 11 NASDAQ (US) stocks by a technical-signal score with daily weighted randomisation — not a recommendation.
Trend & Price Action
The price sits below both of its key moving averages. A moving average smooths recent closing prices into one line, and traders use it as a gauge of the prevailing trend. DASH trades under its 20-day average of 181.61 and its 50-day average of 189.17. The 20-day average itself fell 1.92% over five days, so the trend line is sloping down, not just the price.
The data shows no new moving-average crossover. The shorter average already sits beneath the longer one, which fits a downtrend that is established rather than freshly triggered. A bounce into the 20-day line, with the price still under the 50-day, is the kind of pullback that often fails in a falling market.
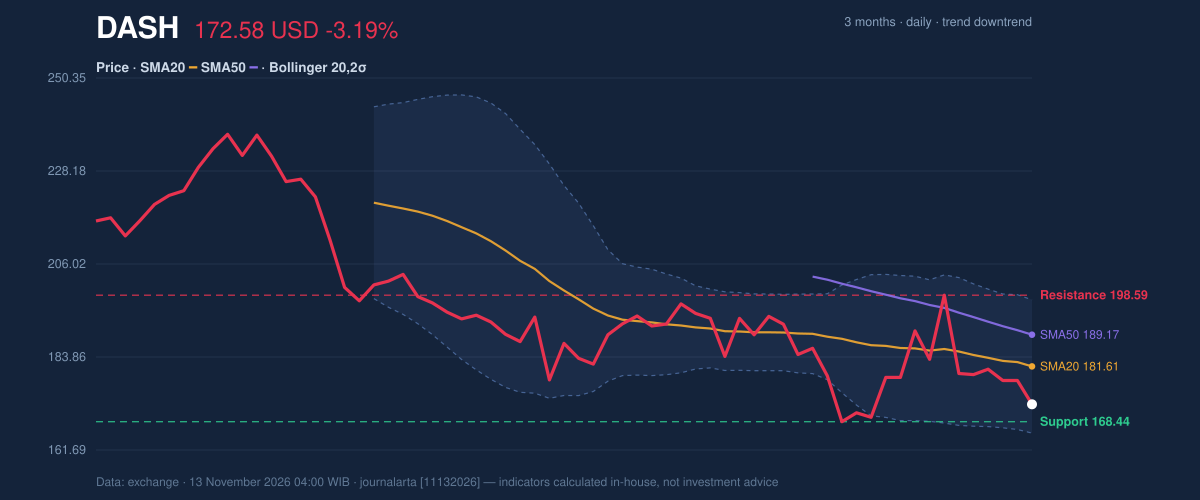
As shown in the chart, the stock trades at about 14% of its 20-day range, between support at 168.44 and resistance at 198.59. Over three months the range is wider, with a high of 238.83 and a low of 163.68. The close is only about five dollars above that low, so the stock is near the bottom of its recent range, not in the middle of it.
Oscillators & Momentum
Momentum indicators confirm the weakness without signaling panic. The 14-day Relative Strength Index (RSI), which measures the speed of recent price moves on a 0-100 scale, reads 41.7, which is neutral. The Stochastic oscillator, which compares the close with its recent range, shows %K at 25.1 and %D at 35.8, also neutral but leaning low.
The MACD line is at -3.560, below its signal line at -3.456. The histogram, the gap between the two, is -0.105. It has just turned negative, which means downward pressure has edged ahead of the signal line. The gap is small, so this reads as a shift in direction, not a rout.
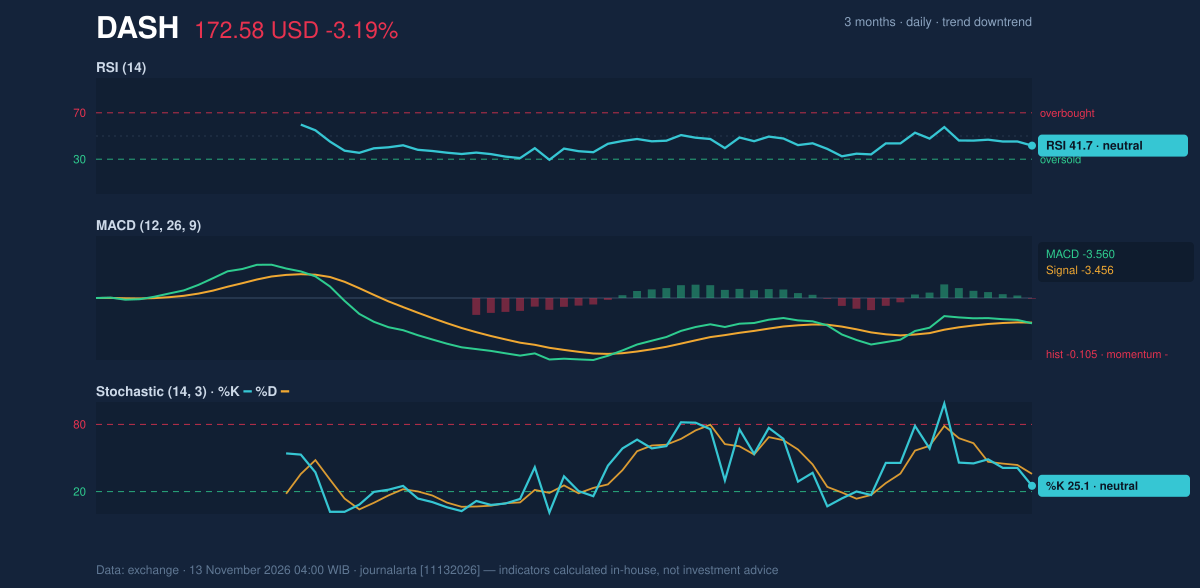
With RSI and Stochastic both neutral, the stock is not yet oversold by these gauges. That leaves room for further decline before a classic oversold reading would appear. Momentum is soft but not exhausted.
Volatility & Volume
The Bollinger Bands put the price near the lower half of their channel. The upper band is 197.50, the middle 181.61 and the lower 165.72. The %B reading of 22% places the close in the lower fifth of the channel. Band width is 17.5%, which the data classes as normal, so there is no squeeze that would point to an imminent breakout.
The Average True Range (ATR), a measure of typical daily swings, is 11.25. That is 6.5% of the share price, which counts as high volatility. A stock that routinely moves that far in a day can cover the distance between its support and the lower band within a few sessions.
Volume tells a mixed story. Thursday's 3,510,600 shares were about 0.6 times the 20-day average of 5,783,370, so the drop came on thin participation. Light-volume declines are sometimes read as lack of conviction. But on-balance volume (OBV), which tallies volume flowing in and out of the stock, is falling, and that points to net selling pressure over the period.
Fundamental Context
The chart weakness contrasts with the company's latest results. According to its SEC filing, DoorDash reported quarterly revenue of $4.62 billion for the quarter ended September 30, 2026, up 34.0% from $3.45 billion a year earlier (Form 10-Q filed October 30, 2026). Net income was $466.0 million, compared with $244.0 million a year earlier, and diluted earnings per share were $1.06. Strong growth has not stopped the share price from sliding, which shows that price action and reported earnings can diverge over a one-month window.
Key Levels & Scenarios
Support at 168.44 is the first floor to watch, with the three-month low of 163.68 just below it. A close beneath those levels would extend the downtrend. On the upside, the 20-day average at 181.61 and the 50-day average at 189.17 form layered resistance. A recovery above the stop level of 191.71 would break the bearish pattern.
Technical Verdict: SELL
JournalArta's research model rates DASH SELL, with a score of -84 on a scale from -100 to +100. A sell call requires -60 or below. Three reasons stand out:
- The price is below its 50-day average, and the 20-day average is below the 50-day, which confirms a downtrend.
- The MACD histogram has just turned negative, and the MACD line sits under its signal line.
- Falling OBV supports the downtrend, and the data records zero bullish signals against three bearish ones.
The verdict is invalidated if the price rises above 191.71.
- Entry range (sell zone): 172.58 – 181.01
- Exit target 1: 143.89
- Exit target 2: 115.19
- Stop loss: 191.71
- Reward/risk: 1.5 to target 1, 3.0 to target 2
This is technical analysis, not investment advice. In plain terms, the chart favors further weakness, and that reading holds until December 11, 2026, unless the price climbs above 191.71 first.
Summary Data DASH
| Last price | 172.58 USD |
| Change 1 day / 5 days / 1 month | -3.19% / -4.08% / -10.60% |
| Trend / MA-cross | downtrend / none |
| SMA20 / SMA50 | 181.61 / 189.17 |
| RSI (14) / Stochastic %K | 41.7 / 25.1 |
| Bollinger %B / ATR | 22% / 11.25 |
| Support / Resistance 20 days | 168.44 / 198.59 |
| Data as of | 13 November 2026 04:00 WIB |
| JournalArta research verdict (score) | Sell (-84) |
| Sell zone | 172.58 – 181.01 |
| Target 1 / 2 | 143.89 / 115.19 |
| Stop loss | 191.71 |
| Reward/risk | 1.5 / 3.0 |
Today's full Buy and Sell list for US stocks →
Disclaimer: This technical analysis is generated automatically from exchange data and indicators calculated by JournalArta, for information and education only. The verdict and the entry, target and stop-loss levels are not investment advice or a solicitation to buy or sell any security. Investment decisions and their risks rest solely with the reader.
Track DASH stock price daily: live levels, support/resistance and our full DASH analysis history.