Southern Stock Falls 1.46% (November 12, 2026): Trading Volume 2.2x Normal
Technical analysis of Southern Company stock on November 12, 2026: price 92.47 USD, trend sideways, RSI 54.5, support 89.27, resistance 94.61.
Southern Company told the U.S. Securities and Exchange Commission on November 5 that it had filed a Form 8-K reporting its results of operations and financial condition. Seven days later, the utility's shares drew their heaviest trading in weeks, and the price moved the wrong way. On Thursday, November 12, the NYSE-listed stock fell 1.46% to $92.47 from a prior close of $93.84, on volume of 15,954,500 shares, about 2.2 times the 20-day average of 7,296,535.
Why Southern Company is in focus today
- Volume at 0.0× the 20-day average
Selected automatically from 6 NYSE (US) stocks by a technical-signal score with daily weighted randomisation — not a recommendation.
Heavy volume on a down day usually means more holders were willing to sell at lower prices. It does not by itself say a trend has turned. Here it landed on a stock that is still up 3.69% over one month, though it is down 0.93% over five days.
Trend & Price Action
The picture is a rising trend that has stalled. The 20-day average sits at $92.62, above the 50-day average at $88.59, and the 20-day average rose 1.42% over five days. That is the structure of an uptrend. But the latest close slipped just under the 20-day line, and the trend reads as sideways. The data shows no new moving-average crossover.
The 20-day average is a rolling mean of closing prices, so it often acts as a waypoint in orderly advances. Thursday's close under it by 15 cents is a small break, but it came on above-average volume.
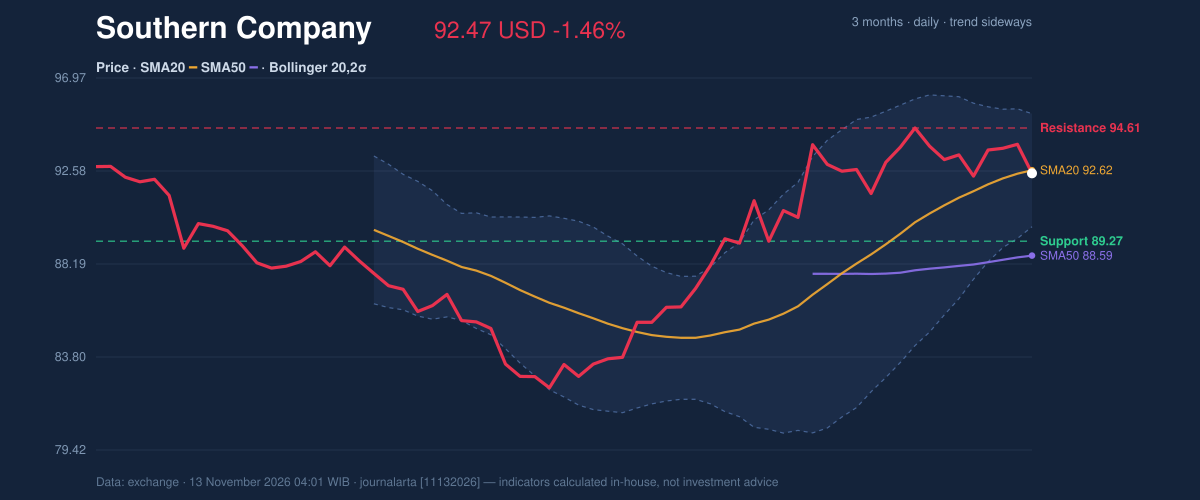
As the chart shows, the stock sits at roughly 60% of its 20-day range, between support at $89.27 and resistance at $94.61. The three-month range runs from $81.69 to $95.72, so the shares are trading near the top of it.
Oscillators & Momentum
Momentum has cooled without breaking. The 14-day RSI, a gauge of how fast prices have risen or fallen on a 0–100 scale, reads 54.5, neutral and well away from the overbought 70 mark. The Stochastic oscillator, which compares the close with its recent high-low range, shows %K at 38.9 against %D at 54.9. The faster line below the slower one points to short-term weakness, but not an oversold reading.
MACD is the more cautious voice. The line stands at 1.355 against a signal line of 1.540, leaving a histogram of -0.186. The line is still positive, so the longer advance is intact, but it has slipped under its own signal line. Momentum is lagging the trend.
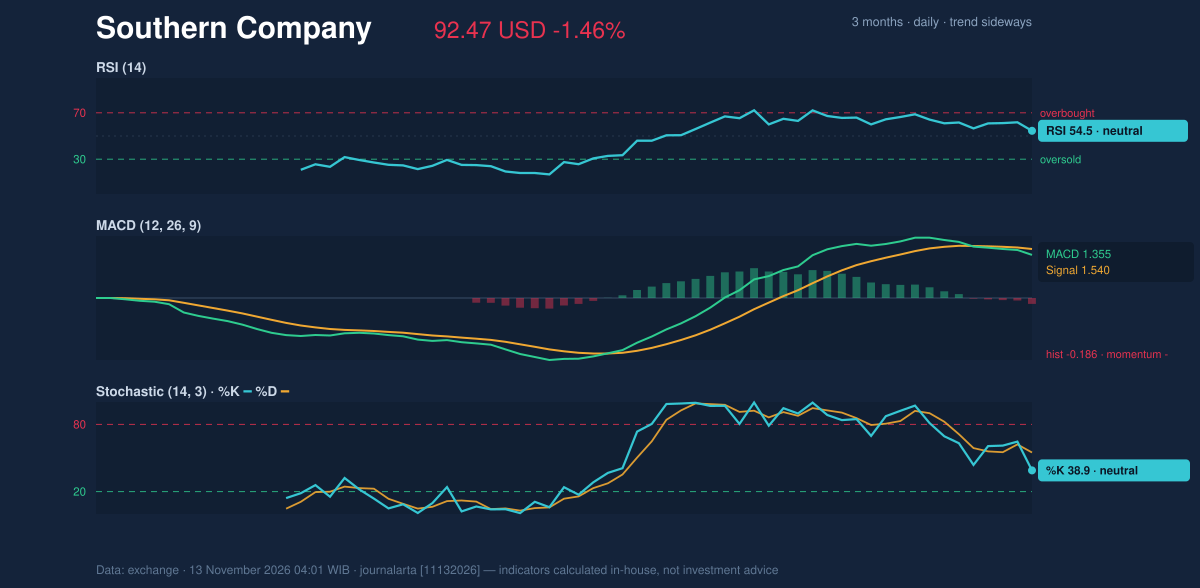
The chart shows the same split. Price holds up while the indicators roll over.
Volatility & Volume
Bollinger Bands, drawn two standard deviations around the 20-day average, span $89.95 to $95.29. Band width is just 5.8% and narrowing, a squeeze that often comes before a larger move. The squeeze itself does not indicate direction. The close at a %B of 47% leaves the price almost exactly mid-band.
The 14-day ATR, the average daily trading range, is $1.88, or 2.0% of the price. That is moderate for a utility. A 1.5×ATR move from here lands at $89.65 on the downside and $95.29 on the upside.
Volume is where the signals clash. The 2.2× surge on a down day is paired with a falling on-balance volume (OBV), which tallies volume on up days minus volume on down days. Sellers have carried the recent heavy sessions. That is a mild warning for the bullish side.
Fundamental Context
According to its SEC filing, Southern Company filed a Form 8-K on November 5 covering its results of operations and financial condition. The filing summary available here carries no figures, so the technical read above does not rest on the earnings numbers. The shares' one-month gain of 3.69% includes the days around that disclosure.
Key Levels & Scenarios
Two levels frame the next move. A close above the 20-day resistance at $94.61 would put the 3-month high of $95.72 and the upper Bollinger band at $95.29 in play. A break below the 20-day support at $89.27 would put the 3-month low at $81.69 in view, with the lower band at $89.95 and the 1.5×ATR mark at $89.65 sitting just above it. Between those lines, the narrowing bands argue that the range is unlikely to hold for long.
Technical Verdict: HOLD (wait & see)
JournalArta's research model scores Southern Company at +43 on a scale of -100 to +100. A buy call needs +60 or above, and a sell call needs -60 or below, so the call is HOLD (wait & see). The strongest reasons:
- Trend support: price is above the 50-day average and the 20-day average is above the 50-day.
- Momentum disagreement: MACD histogram at -0.186 and a falling OBV conflict with a neutral RSI of 54.5.
- Unresolved squeeze: Bollinger width of 5.8% and a mid-band %B of 47% show no direction yet.
Conditional scenarios, drawn only from the reference levels:
- Upside scenario: entry range on a close above $94.61; target $95.72 (3-month high); stop-loss at $92.62 (20-day average).
- Downside scenario: entry range on a break below $89.27; target $81.69 (3-month low); stop-loss at $92.62 (20-day average).
The HOLD verdict is invalidated if price closes above $94.61 or breaks below $89.27. This is technical analysis, not an investment recommendation.
In plain terms, the stock is stuck between $89.27 and $94.61 after a heavy-volume slip, and a decisive move outside that band is what the chart is waiting for.
Summary Data Southern Company
| Last price | 92.47 USD |
| Change 1 day / 5 days / 1 month | -1.46% / -0.93% / 3.69% |
| Trend / MA-cross | sideways / none |
| SMA20 / SMA50 | 92.62 / 88.59 |
| RSI (14) / Stochastic %K | 54.5 / 38.9 |
| Bollinger %B / ATR | 47% / 1.88 |
| Support / Resistance 20 days | 89.27 / 94.61 |
| Data as of | 13 November 2026 04:01 WIB |
| JournalArta research verdict (score) | Hold (+43) |
Today's full Buy and Sell list for US stocks →
Disclaimer: This technical analysis is generated automatically from exchange data and indicators calculated by JournalArta, for information and education only. The verdict and the entry, target and stop-loss levels are not investment advice or a solicitation to buy or sell any security. Investment decisions and their risks rest solely with the reader.
Track Southern Company stock price daily: live levels, support/resistance and our full Southern Company analysis history.