Arista Networks (ANET) Stock Jumps 5.06% (November 12, 2026): Up 11.3% in a Month
Technical analysis of ANET stock on November 12, 2026: price 206.63 USD, trend sideways, RSI 60.3, support 159.16, resistance 206.63.

Why ANET is in focus today
- One-day move of 0.00%, about 0.0× its average daily range (ATR)
Selected automatically from 6 NYSE (US) stocks by a technical-signal score with daily weighted randomisation — not a recommendation.
Trend & Price Action
The stock now trades above its 20-day simple moving average (SMA20) of 179.50, but below its 50-day average (SMA50) of 192.81 on the measure that matters for trend direction. The 20-day average sits under the 50-day, which is the arrangement of a market still repairing damage. The 20-day average itself fell 1.85% over five days, even as the price surged. That is why the trend reads as sideways rather than bullish: a sharp, short burst has lifted the price far above an average that has not caught up. No new moving-average crossover has formed. The price now sits at the top of its 20-day range. Support over 20 days is 159.16 and resistance is 206.63, exactly where the stock closed, so the price sits at 100% of that range. The three-month high is 217.41 and the low is 158.35. The stock has therefore recovered a large share of its three-month range, but it has not yet cleared the high.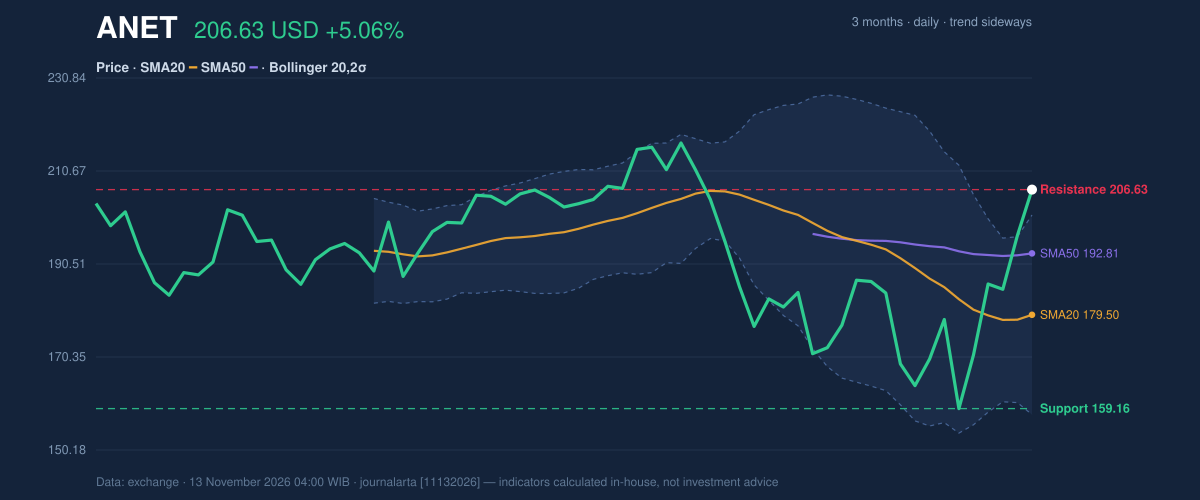
Oscillators & Momentum
The momentum gauges give a more mixed message. The 14-day Relative Strength Index (RSI), which measures the speed of recent gains against losses, stands at 60.3. That is neutral territory, well short of the overheated readings that often precede a pause. The Stochastic oscillator, which shows where the close sits within its recent high-low range, is more extreme. %K is 98.9 and %D is 90.5, both in overbought territory. In plain terms, the stock is closing near the top of its range, and the Stochastic has little room to rise further. MACD, which compares short- and long-term price trends, remains below zero at -1.101 against a signal line of -4.941. The histogram is 3.841, meaning momentum is positive and the gap to the signal line is closing quickly. A MACD that is still negative while the price jumps suggests the rebound has happened faster than the longer-term trend measure can confirm.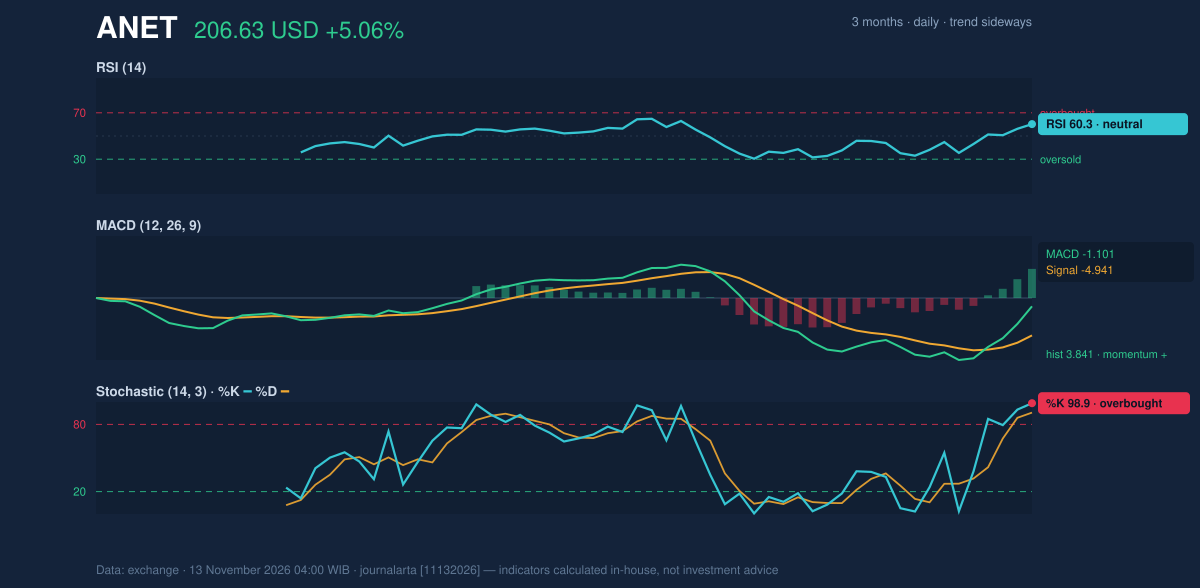
Volatility & Volume
The Average True Range (ATR), a measure of the typical daily swing, is 12.51, or 6.1% of the price. A stock that routinely moves by that much can hit protective levels easily, so any scenario needs wide margins. Volume offers only modest support for the rally. Thursday's volume was 9,758,100 shares against a 20-day average of 8,547,175, which is 1.1 times normal. On-balance volume, which adds volume on up days and subtracts it on down days, is rising. Participation is therefore confirming the direction, but without the surge that usually accompanies a decisive breakout.Fundamental Context
According to its SEC filing, Arista reported quarterly revenue of $3.66 billion for the quarter ended September 30, up 58.5% from $2.31 billion a year earlier (Form 10-Q filed November 4). Net income was $1.56 billion, compared with $853.0 million a year earlier, and diluted earnings per share were $1.22. Growth at that pace helps explain why buyers have returned, though the technical picture shows a market that has moved quickly and not yet settled.Key Levels & Scenarios
The price sits at the 20-day resistance of 206.63. A close above it would put the 3-month high of 217.41 in view, and the 1.5×ATR extension above the price is 225.39. A failure to hold above that level would turn attention to 187.87, which is 1.5 times the ATR below the price. Below that, the 20-day support at 159.16, close to the 3-month low of 158.35, is the next structural floor.Technical Verdict: HOLD (wait & see)
JournalArta's research model scores the stock at +20 on a scale from -100 to +100, well short of the +60 needed for a buy call. The call is HOLD (wait & see), and the reasons are:- Trend and momentum are not aligned: the price is above the 50-day average, but the 20-day average is below it and still sloping down.
- Stochastic is overbought at 98.9, and the price sits above the upper Bollinger Band, so the short-term rise is stretched.
- MACD is still negative at -1.101, even though the histogram is positive.
- Upside scenario (entry range): a close above the 20-day resistance of 206.63.
- Exit target: 217.41, the 3-month high, with 225.39 as the extended level.
- Stop loss: 187.87, the price minus 1.5×ATR.
- Downside scenario: a break of the 20-day support at 159.16, with the 3-month low of 158.35 just beneath.
Summary Data ANET
| Last price | 206.63 USD |
| Change 1 day / 5 days / 1 month | 5.06% / 29.83% / 11.34% |
| Trend / MA-cross | sideways / none |
| SMA20 / SMA50 | 179.50 / 192.81 |
| RSI (14) / Stochastic %K | 60.3 / 98.9 |
| Bollinger %B / ATR | 113% / 12.51 |
| Support / Resistance 20 days | 159.16 / 206.63 |
| Data as of | 13 November 2026 04:00 WIB |
| JournalArta research verdict (score) | Hold (+20) |
Today's full Buy and Sell list for US stocks →
Disclaimer: This technical analysis is generated automatically from exchange data and indicators calculated by JournalArta, for information and education only. The verdict and the entry, target and stop-loss levels are not investment advice or a solicitation to buy or sell any security. Investment decisions and their risks rest solely with the reader.
Track ANET stock price daily: live levels, support/resistance and our full ANET analysis history.