Ford Motor (FORD) Stock Latest: Slides 2.86% on Thursday, Down 5% in Five Sessions
Technical analysis of Ford stock on November 12, 2026: price 11.90 USD, trend sideways, RSI 41.7, support 11.58, resistance 12.67.
By Elena Vance
November 13, 20265 min read
Logo Ford Motor — JournalArta illustration
Why Ford is in focus today
One-day move of 0.00%, about 0.0× its average daily range (ATR)
Selected automatically from 6 NYSE (US) stocks by a technical-signal score with daily weighted randomisation — not a recommendation.
Ford's shares have slipped to the bottom of their one-month range just as the carmaker's latest filing shows revenue shrinking, a combination that leaves international investors weighing a $12 stock against thinning momentum.
Ford (NYSE: F) closed Thursday, November 12, 2026, at $11.90, down from a previous close of $12.25. That is a 2.86% drop in one session, extending a 5.03% slide over five days and a 3.33% decline over one month. The selection signal that put Ford on today's list was a one-day move of 0.00% against its average daily range, a reminder that the stock sits in a quiet pocket even as it drifts lower.
Advertisement
Trend & Price Action
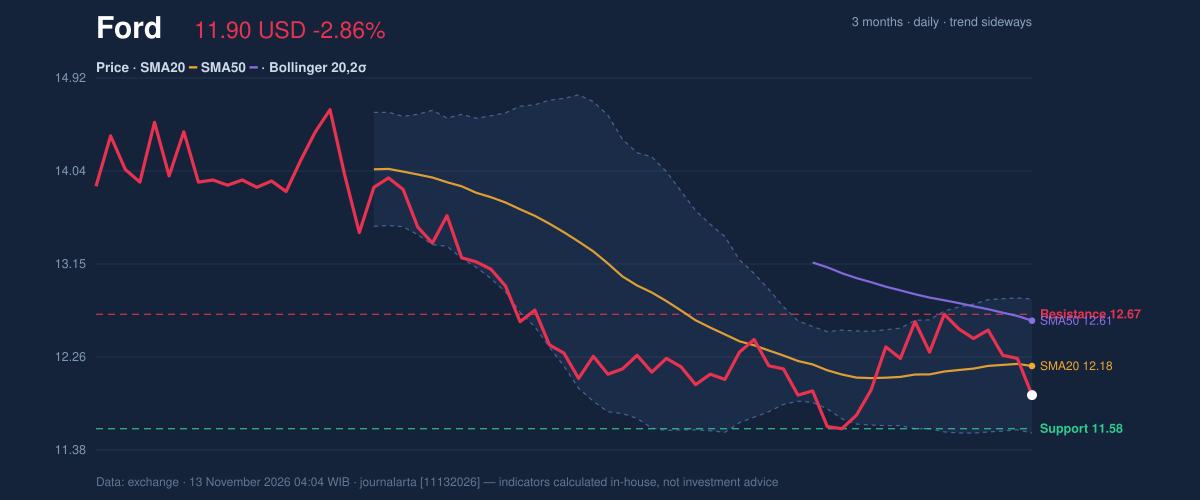
The broader trend reads as sideways. The 20-day moving average, which smooths the last four weeks of closing prices, rose only 0.31% over five days, a very gentle slope. Over the same stretch the price itself fell, which is why the picture is mixed rather than clearly bearish.
Ford now trades below its 20-day average of $12.18 and its 50-day average of $12.61. When a price sits beneath both averages, the shorter-term buyers who paid more recently are underwater, and rallies tend to meet selling from holders hoping to break even. There is no fresh moving-average crossover to change that reading.
The stock sits at about 29% of its 20-day range, which runs from support at $11.58 to resistance at $12.67. Over three months, the high is $14.64 and the low is $11.44. Ford is therefore only 46 cents above its three-month floor and well off its peak, as shown in the chart below.
3-month price action chart of Ford: price, SMA20/50, Bollinger, support & resistance.
Advertisement
Oscillators & Momentum
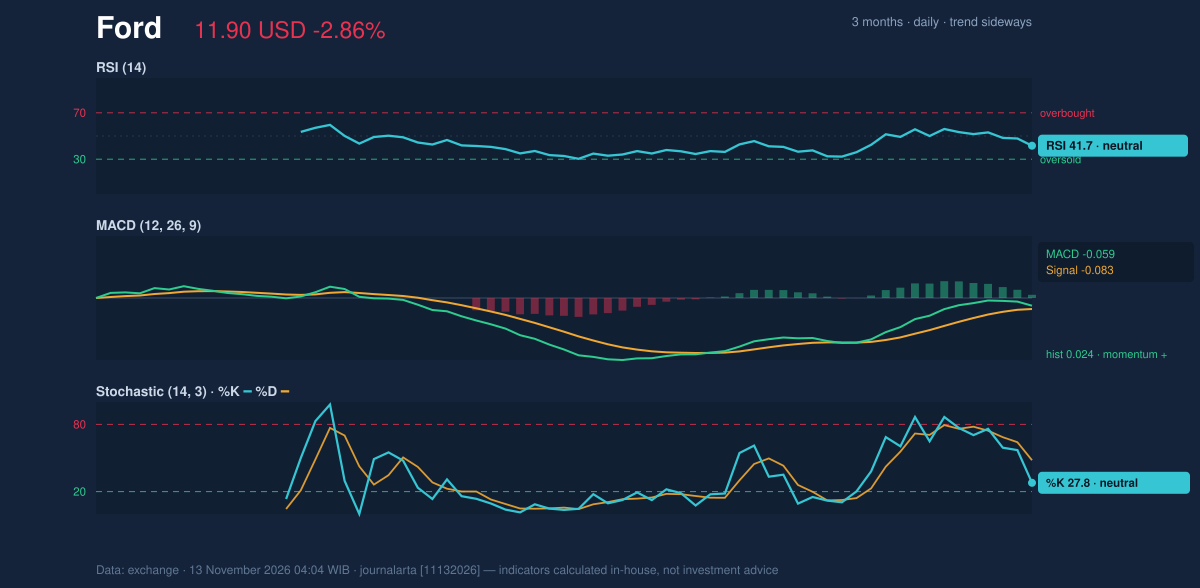
Momentum gauges are lukewarm rather than alarming. The 14-day RSI is 41.7, in neutral territory. RSI measures the pace of recent gains against losses on a 0–100 scale; readings below 30 are usually read as oversold, so Ford has room to fall further before that flag appears.
The Stochastic oscillator shows %K at 27.8 and %D at 48.0, also neutral. The faster %K line sitting well below %D shows the latest closes landing in the lower part of the recent range.
The MACD is -0.059 against a signal line of -0.083, leaving a histogram of 0.024. Both lines remain negative, but the MACD is above its signal line, which indicates that downward momentum is easing even though the stock fell on Thursday. That is the main point of friction in the data: price is weak while one momentum gauge is improving.
Momentum chart of Ford: RSI(14), MACD, Stochastic.
Advertisement
Volatility & Volume
Bollinger Bands, which place a channel two standard deviations around the 20-day average, span $11.54 to $12.82. Ford's %B reading is 28%, meaning it sits in the lower third of the channel, and the band width of 10.5% is normal rather than squeezed or stretched. A normal width suggests no breakout is being coiled.
The 14-day Average True Range is $0.36, or 3.0% of the share price, a moderate level of daily swing. Put simply, a move of roughly 36 cents in a day is ordinary for this stock.
Participation was subdued. Thursday's volume of 34.26 million shares was 0.8 times the 20-day average of 43.63 million, and on-balance volume, which adds volume on up days and subtracts it on down days, is falling. The decline came on lighter-than-normal trading, so sellers were not rushing the exit, but buyers did not step in either.
Advertisement
Fundamental Context
According to its SEC filing, Ford reported quarterly revenue of $49.53 billion for the quarter ended September 30, 2026, down 2.0% from $50.53 billion a year earlier (Form 10-Q filed October 29). Net income was $2.05 billion, compared with $2.45 billion in the same quarter a year earlier, and diluted earnings per share were $0.50. The softer top and bottom lines fit with a share price that has struggled to hold above its averages.
Key Levels & Scenarios
Resistance at $12.67 and support at $11.58 frame the next move. Between them lies the 20-day average at $12.18, the first hurdle for any recovery. A close above $12.67 would show buyers reclaiming the top of the recent range. A break below $11.58 would put the three-month low of $11.44 in play.
Advertisement
Technical Verdict: HOLD (wait & see)
JournalArta's research model scores Ford HOLD at -50 on a scale from -100 to +100, short of the -60 threshold for a sell call. The strongest reasons:
- Trend: the price is below both the 20-day and 50-day averages, and the 20-day average is below the 50-day.
- Momentum: RSI at 41.7 is neutral and the five-day drop of 5.03% is a drag, while the MACD histogram of 0.024 hints that selling pressure is easing. Trend and momentum are not yet aligned.
- Volume: falling OBV on 0.8 times normal volume shows no strong conviction in either direction.
Conditional scenarios, drawn only from the reference levels:
- Upside scenario (entry range): a close above the 20-day resistance of $12.67.
- Exit target: the 1.5×ATR upside marker at $12.44 on a partial recovery, and the three-month high of $14.64 only if resistance gives way.
- Downside scenario / stop loss: a break of the 20-day support at $11.58, with the 1.5×ATR downside marker at $11.36 as the protective line.
The verdict is invalidated if price closes above $12.67 or falls below $11.58. In plain terms, Ford's chart is stuck in the middle with no clear direction, and the data suggests waiting for a decisive move before drawing conclusions. This is technical analysis, not an investment recommendation.
Ford's three-month low of $11.44 is just 46 cents beneath Thursday's close.
Disclaimer: This technical analysis is generated automatically from exchange data and indicators calculated by JournalArta, for information and education only. The verdict and the entry, target and stop-loss levels are not investment advice or a solicitation to buy or sell any security. Investment decisions and their risks rest solely with the reader.