Blackstone (BX) Stock Slides 2.84%: Down 1.1% in Five Sessions
Technical analysis of BX stock on November 12, 2026: price 118.54 USD, trend sideways, RSI 49.2, support 106.61, resistance 125.57.
By Elena Vance
November 13, 20265 min read
Logo Blackstone — JournalArta illustration
Why BX is in focus today
One-day move of 0.00%, about 0.0× its average daily range (ATR)
Selected automatically from 6 NYSE (US) stocks by a technical-signal score with daily weighted randomisation — not a recommendation.
Blackstone shares fell 2.84% to $118.54 on the New York Stock Exchange in the session of Thursday, November 12, 2026, down from a prior close of $122.01. The drop trimmed the stock's five-day change to -1.07%, though it is still up 8.55% over one month. Those numbers describe a stock that has rallied and is now pausing, and the indicators point both ways.
Trend & Price Action
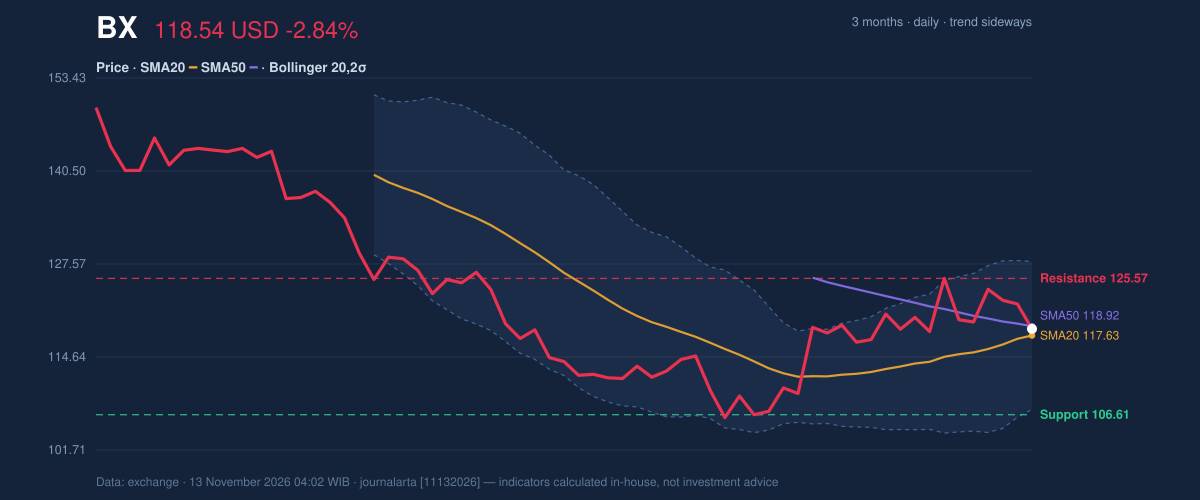
The trend reads sideways. Blackstone sits above its 20-day average of 117.63 but below its 50-day average of 118.92. The gap between the two is narrow, so the stock is moving in a tight band around its short- and medium-term averages. The 20-day average sits below the 50-day, and no new crossover has formed. The 20-day average itself rose 2.27% over five days, which shows the recent bounce has lifted the short-term baseline even though price has not yet cleared the longer one.
Short-term support is at 106.61 and resistance at 125.57. At 118.54, the stock sits about 63% of the way up that range, with room on both sides. The three-month range is much wider, running from a low of 105.44 to a high of 150.24. That makes the current price a recovery well off the lows and still far below the peak. As the chart shows, price is hugging the middle of the Bollinger structure rather than testing an edge.
3-month price action chart of BX: price, SMA20/50, Bollinger, support & resistance.
Advertisement
Oscillators & Momentum
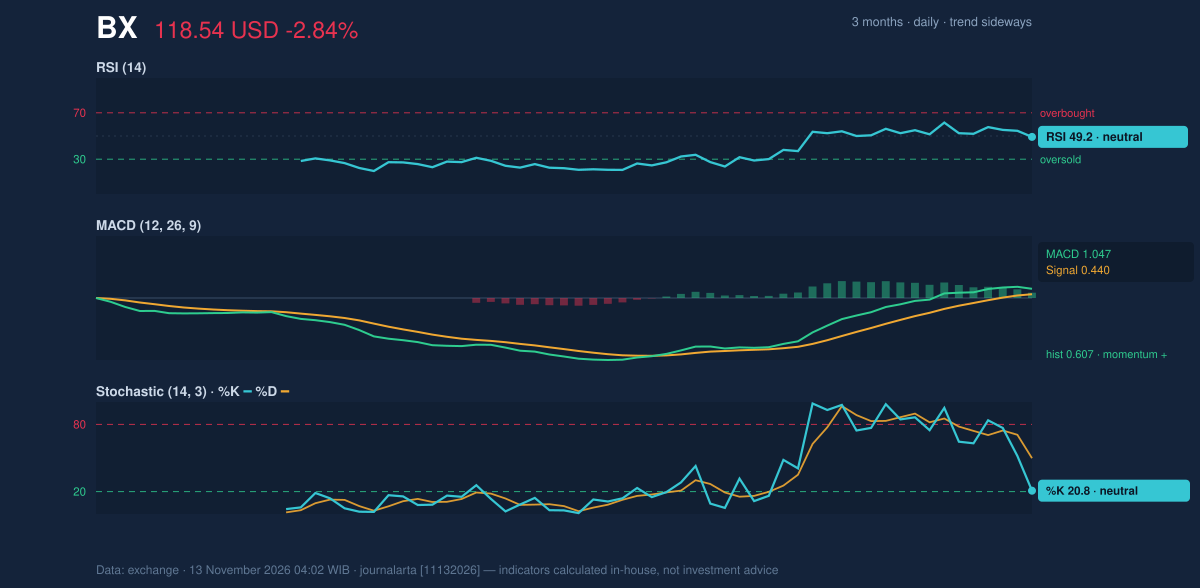
Momentum is mixed. The 14-day RSI, which measures the pace of recent gains against losses, is 49.2, neutral and almost exactly mid-scale. Neither buyers nor sellers hold a clear edge.
The Stochastic oscillator is less balanced. Its fast line (%K) is 20.8 against a slower line (%D) of 49.8. The fast line has dropped well below the slow line, which usually means the latest session pulled price toward the bottom of its recent range. This is the kind of reading that comes before either a bounce or a further slide, and it has not yet resolved.
MACD, which compares two moving averages to gauge momentum, is still positive. The line is 1.047 against a signal of 0.440, a histogram of 0.607. The earlier one-month advance has not faded from this measure. A positive MACD alongside a sharp one-day drop suggests the pullback has not yet changed the medium-term picture.
Momentum chart of BX: RSI(14), MACD, Stochastic.
Advertisement
Volatility & Volume
The Bollinger Bands, which mark two standard deviations around the 20-day average, run from 107.35 to 127.91, with the midline at 117.63. Price sits at 54% of the band (%B), and the band width of 17.5% is classed as normal. There is no squeeze or sharp expansion here.
The 14-day Average True Range (ATR), a gauge of typical daily movement, is 4.14, or 3.5% of the price. That is moderate volatility. A 1.5× ATR move from here would put the stock near 112.33 on the downside or 124.75 on the upside, a range that sits inside the 20-day support and resistance.
Volume is the weak link. Thursday's turnover of 2,885,800 shares was about 0.5× the 20-day average of 5,724,020, which makes it thin. On-balance volume, a running tally of volume on up days versus down days, is falling. A 2.84% decline on light trading may mean sellers were not aggressive. Even so, falling OBV shows that volume has not been confirming the one-month rise.
Advertisement
Fundamental Context
According to its SEC filing (Form 10-Q, filed November 6, 2026), Blackstone reported quarterly revenue of $3.06 billion for the quarter ended September 30, 2026, down 0.8% from $3.09 billion a year earlier. Net income was $662.4 million, compared with $624.9 million a year earlier, and diluted earnings per share were $0.83. On November 2, 2026, the company also filed a Form 8-K with the SEC reporting a material definitive agreement and other material events. The filing summary gives no further detail here. Flat revenue with higher profit is a mixed backdrop, which fits the stock's indecision.
Technical Verdict: HOLD (wait & see)
The JournalArta research score is -50 on a -100 to +100 scale, short of the -60 needed for a Sell and well below the +60 needed for a Buy. The call is HOLD (wait & see) because trend and momentum are not aligned.
- Averages: price is below the 50-day average and the 20-day average is below the 50-day, which caps the trend.
- RSI: at 49.2 it is neutral, with no momentum edge in either direction.
- Five-day change: a 1.07% drop leaves the short-term tone slightly negative, while MACD stays positive.
Both scenarios below are conditional and use only the reference levels:
- Upside scenario: a close above the 20-day resistance of 125.57. Reference target: the 3-month high of 150.24. Protective stop: the 20-day average at 117.63.
- Downside scenario: a break below the 20-day support of 106.61. Reference level: the 3-month low of 105.44. Protective stop: a move back above 112.33.
The verdict is invalidated if price closes above 125.57 or breaks below 106.61.
In plain terms, the chart is not giving a clear direction, and the data say the next decisive move has not started yet.
Disclaimer: This technical analysis is generated automatically from exchange data and indicators calculated by JournalArta, for information and education only. The verdict and the entry, target and stop-loss levels are not investment advice or a solicitation to buy or sell any security. Investment decisions and their risks rest solely with the reader.