Nvidia (NVDA) Stock Latest: Slides 4.34% on Thursday, Down 23.5% in a Month
Technical analysis of NVDA stock on November 12, 2026: price 166.19 USD, trend downtrend, RSI 25.8, support 166.19, resistance 221.97.
Why NVDA is in focus today
- One-day move of 0.00%, about 0.0× its average daily range (ATR)
- Volume at 0.0× the 20-day average
Selected automatically from 11 NASDAQ (US) stocks by a technical-signal score with daily weighted randomisation — not a recommendation.
Trend & Price Action
The price now sits below both the 20-day simple moving average (SMA20) at $201.25 and the 50-day average (SMA50) at $215.96. A simple moving average is the mean closing price over a set number of sessions; trading beneath both signals that recent buyers are underwater on average. The SMA20 is also below the SMA50, and the 20-day average fell 5.82% over five days. That slope is a measure of the average's direction, not the stock's own decline, but it confirms the pull is downward. No new crossover formed on the latest session. The 20-day range runs from support at $166.19 to resistance at $221.97, and the price sits at 0% of that range. In plain terms, the stock closed at the floor of its recent trading band. As shown in the chart below, price has slid from the middle of the Bollinger band to its lower edge.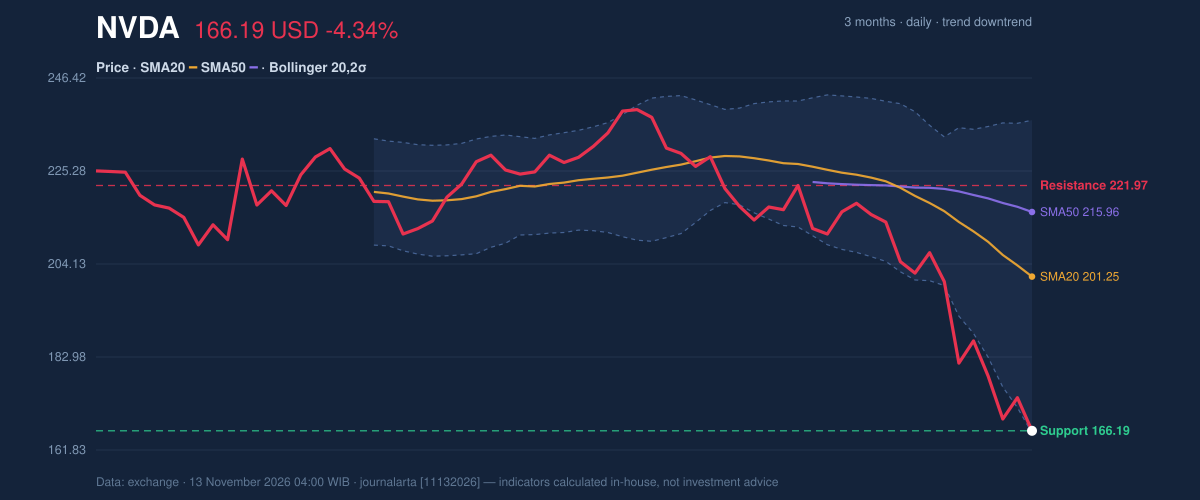
Oscillators & Momentum
The Relative Strength Index (RSI) over 14 sessions reads 25.8, in oversold territory below 30. The indicator compares the size of recent gains with recent losses; a low reading says sellers have dominated almost every session lately. Oversold does not mean a rebound is due. In a downtrend, RSI can stay depressed for weeks. The Stochastic oscillator tells a milder story: %K at 24.4 and %D at 14.8 are classed neutral. The MACD line, a gauge of the gap between short- and long-term momentum, is at -13.346 against a signal line of -9.232, leaving a histogram of -4.114. The widening gap below the signal line shows negative momentum still building, not fading.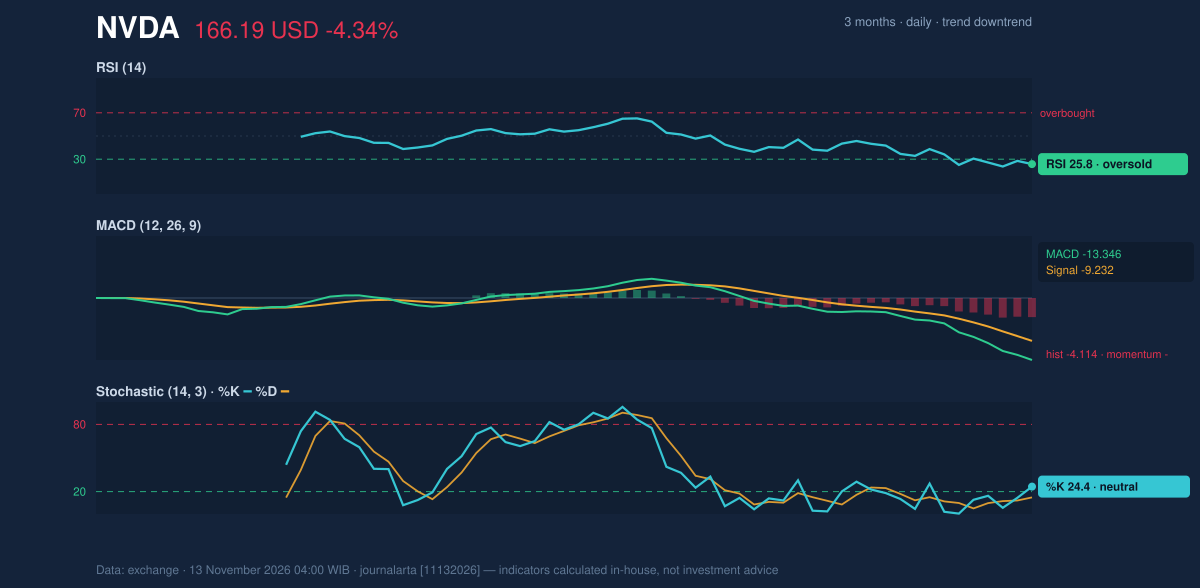
Volatility & Volume
The 14-day Average True Range (ATR) is 10.66, or 6.4% of the price. That means the stock has typically moved more than $10 a day recently, so wide swings in either direction are the norm. The volume spike matters too. A close below the 20-day low on volume at least 1.5 times average is one of two bearish signals the code flagged; the other is a downtrend confirmed by falling on-balance volume (OBV), a running tally that adds volume on up days and subtracts it on down days. Falling OBV suggests heavier trading is occurring on declines. No bullish signals were recorded.Fundamental Context
The selloff contrasts with the company's reported results. According to its SEC filing, Nvidia posted quarterly revenue of $96.22 billion for the quarter ended July 26, 2026, up 105.9% from $46.74 billion a year earlier (Form 10-Q filed August 26). Net income was $59.69 billion versus $26.42 billion a year earlier, with diluted earnings per share of $2.46. The price weakness therefore reflects trading dynamics rather than a deterioration visible in those filings. Separately, Nvidia filed a Form 8-K with the SEC on November 12 reporting a change of directors or officers, the same day as the heavy-volume decline; the filing's content is not detailed here, and no link between the two is established.Key Levels & Scenarios
The $166.19 support coincides almost exactly with the lower Bollinger band at $165.68. If the stock holds there, the 20-day average near $201.25 is the first reference for any recovery. If it fails to hold, the three-month low of $148.80 comes into view. Resistance sits at $221.97, well above the current price.Technical Verdict: SELL
JournalArta's research model scores NVDA at -71 on a scale from -100 to +100, below the -60 threshold that triggers a SELL reading. The strongest reasons: - Trend: price is below both the 50-day average and the 20-day average, which itself sits below the 50-day, a confirmed downtrend. - Volume: the close under the 20-day low came on 3.8 times average volume, with OBV falling. - Momentum: MACD at -13.346 remains below its signal line at -9.232. Levels, valid until December 11, 2026: - Ideal entry range (sell zone): $166.19 – $174.17 - Exit targets: target 1 at $139.03; target 2 at $111.86 - Stop loss: $184.30 - Reward/risk: 1.5 for target 1, 3.0 for target 2 The verdict is invalidated if price closes above $184.30. The oversold RSI of 25.8 is the main counter-risk, since it can precede sharp relief rallies. In plain terms, the chart currently favors sellers, though a stock this stretched can bounce quickly. This is technical analysis, not an investment recommendation. | Indicator | Value | |---|---| | Last price | $166.19 | | 1-day / 5-day / 1-month change | -4.34% / -8.49% / -23.50% | | SMA20 / SMA50 | $201.25 / $215.96 | | Bollinger lower / middle / upper | $165.68 / $201.25 / $236.83 | | RSI(14) | 25.8 | | Stochastic %K / %D | 24.4 / 14.8 | | MACD / signal / histogram | -13.346 / -9.232 / -4.114 | | ATR(14) | 10.66 | | 20-day support / resistance | $166.19 / $221.97 | | 3-month high / low | $243.37 / $148.80 | Nvidia's 8-K, filed November 12, is the newest document on record.Summary Data NVDA
| Last price | 166.19 USD |
| Change 1 day / 5 days / 1 month | -4.34% / -8.49% / -23.50% |
| Trend / MA-cross | downtrend / none |
| SMA20 / SMA50 | 201.25 / 215.96 |
| RSI (14) / Stochastic %K | 25.8 / 24.4 |
| Bollinger %B / ATR | 1% / 10.66 |
| Support / Resistance 20 days | 166.19 / 221.97 |
| Data as of | 13 November 2026 04:00 WIB |
| JournalArta research verdict (score) | Sell (-71) |
| Sell zone | 166.19 – 174.17 |
| Target 1 / 2 | 139.03 / 111.86 |
| Stop loss | 184.30 |
| Reward/risk | 1.5 / 3.0 |
Today's full Buy and Sell list for US stocks →
Disclaimer: This technical analysis is generated automatically from exchange data and indicators calculated by JournalArta, for information and education only. The verdict and the entry, target and stop-loss levels are not investment advice or a solicitation to buy or sell any security. Investment decisions and their risks rest solely with the reader.
Track NVDA stock price daily: live levels, support/resistance and our full NVDA analysis history.