Xcel Energy (XEL) Stock Latest: Rises 0.49% on Thursday, Near a 3-Month High
Technical analysis of XEL stock on November 12, 2026: price 81.50 USD, trend uptrend, RSI 68.5, support 75.14, resistance 81.50.
A US utility stock just posted its heaviest trading day of the month on a breakout, a pattern that tends to draw wider attention to defensive sectors. Xcel Energy (XEL) closed Thursday's session, November 12, 2026, at $81.50, up from a prior close of $81.10. Volume reached 17,451,500 shares, 2.3 times the 20-day average of 7,710,390.
Why XEL is in focus today
- Volume at 0.0× the 20-day average
Selected automatically from 11 NASDAQ (US) stocks by a technical-signal score with daily weighted randomisation — not a recommendation.
Price rose 0.49% on the day, 1.41% over five days and 8.49% over one month. A move that size from a regulated utility is unusual, and the volume suggests the buying was not thin.
Trend & Price Action
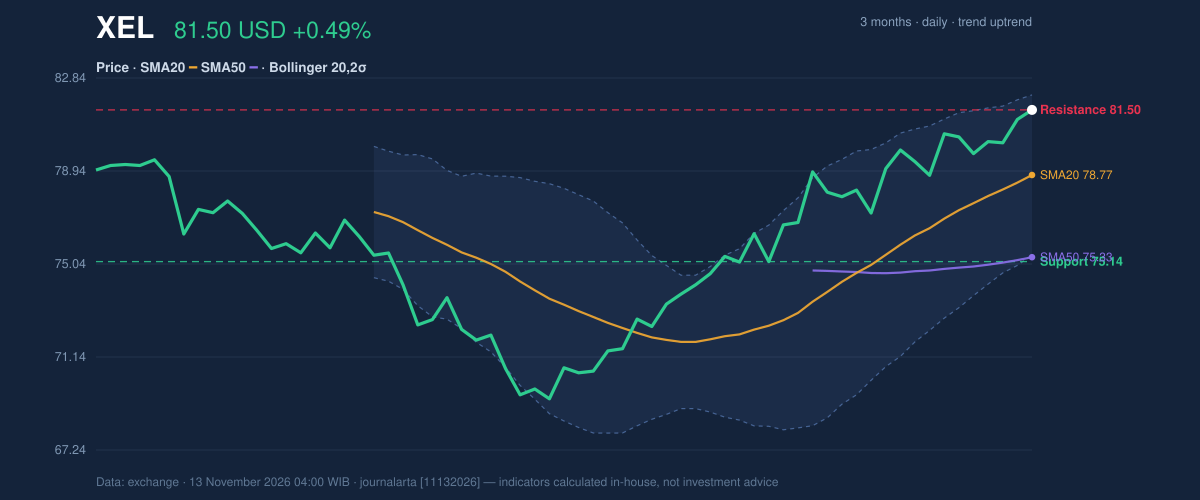
The structure is clean. XEL trades above both its 20-day average of $78.77 and its 50-day average of $75.33, and the trend reads as an uptrend. The 20-day average rose 1.91% over five days, showing the lift is broad rather than a single-day spike. There is no new moving-average crossover, so the 20-day sitting above the 50-day is an established condition, not a fresh signal.
As the chart shows, the close sits exactly on the 20-day resistance of $81.50, meaning price is at 100% of its 20-day range. Support over the same window is $75.14. The three-month range runs from $68.72 to $81.97, so the stock is within a few cents of its recent ceiling.
Oscillators & Momentum
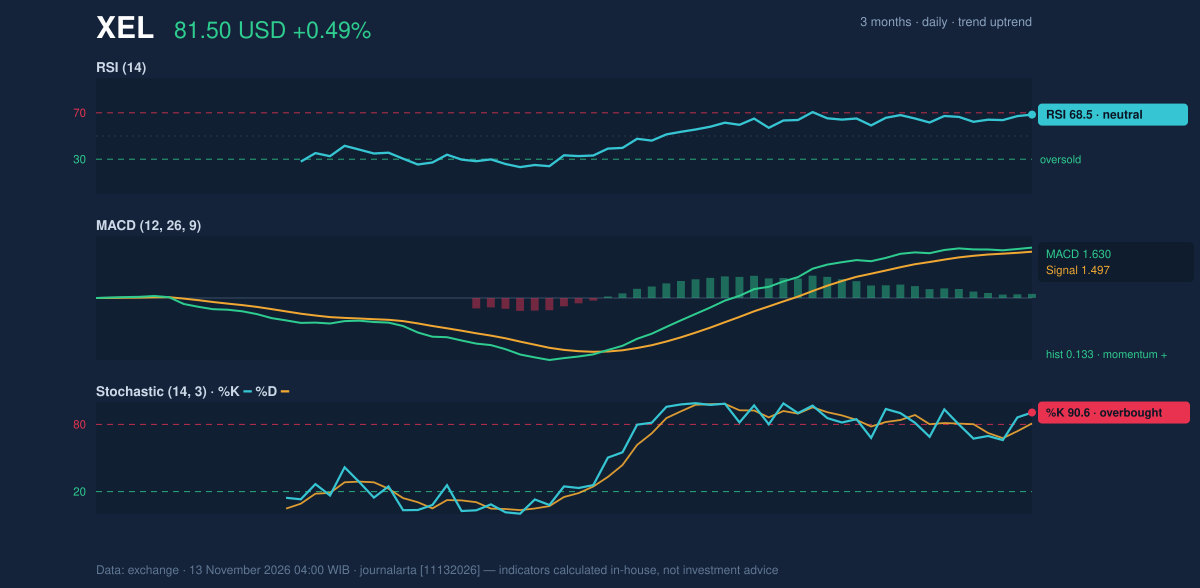
Momentum agrees with the trend, but it is stretched. The RSI(14) is 68.5, still classed as neutral but close to the 70 line that traders often treat as the edge of overbought. The Stochastic %K is 90.6 against %D at 80.9, a clear overbought reading. In plain terms, the stock has risen quickly enough that a pause or a small pullback would be ordinary behavior.
The MACD is 1.630 against a signal line of 1.497, leaving a histogram of 0.133. A positive histogram means short-term momentum still exceeds its own recent average. That keeps the picture constructive even as the Stochastic runs hot.
Volatility & Volume
The Bollinger Bands (20 days, 2 standard deviations) span $75.41 to $82.13, with the midline at $78.77. Band width is 8.5%, which is normal, and %B is 91%, so price is hugging the upper band. A close near the upper band can signal strength, though it also leaves little room before $82.13 is tested.
The ATR(14) is 1.56, or 1.9% of the price, which points to moderate volatility. Daily swings of that size would carry the stock through the nearby levels without much effort.
Volume is the most important confirmation. Closing above the 20-day high on more than twice average volume suggests real participation, not a drift higher on thin trading. On-balance volume, which tallies volume on up days against down days, is rising and supports the same reading. The code that screens these signals flags two bullish signals and none bearish.
Fundamental Context
According to its SEC filings, Xcel Energy submitted a Form 8-K on November 3, 2026, and another on November 2, 2026, each reporting other material events. The filings' headline descriptions carry no figures, so they do not change the technical reading. They do mark a company that disclosed news just days before the volume surge.
Key Levels & Scenarios
The conditional picture is straightforward. A sustained close above $81.50 and then the three-month high of $81.97 would put the upper band near $82.13 in play. If price fails to hold the 20-day average near $78.77, the breakout would lose much of its footing, and the next marker is the 20-day support at $75.14.
Technical Verdict: BUY
JournalArta's research model scores XEL at +81 on a scale of −100 to +100, above the +60 threshold for a BUY call. Three reasons stand out:
- Trend: price is above the 50-day average, and the 20-day average sits above it.
- Volume: the close above the 20-day high came on 2.3× average volume, with rising OBV.
- Momentum: the MACD histogram is positive at 0.133.
The main risk is the Stochastic at 90.6, which signals overbought conditions. The verdict is invalidated if price falls below $78.83.
- Entry range: $80.33 – $81.50
- Exit target 1: $85.50
- Exit target 2: $89.51
- Stop loss: $78.83
- Reward/risk: 1.5 to target 1, 3.0 to target 2
These levels are valid until December 11, 2026. This is technical analysis, not an investment recommendation. In plain terms, the chart favors the upside for now, but the stock has run hard and a short pause would not be surprising.
Summary Data XEL
| Last price | 81.50 USD |
| Change 1 day / 5 days / 1 month | 0.49% / 1.41% / 8.49% |
| Trend / MA-cross | uptrend / none |
| SMA20 / SMA50 | 78.77 / 75.33 |
| RSI (14) / Stochastic %K | 68.5 / 90.6 |
| Bollinger %B / ATR | 91% / 1.56 |
| Support / Resistance 20 days | 75.14 / 81.50 |
| Data as of | 13 November 2026 04:00 WIB |
| JournalArta research verdict (score) | Buy (+81) |
| Entry zone | 80.33 – 81.50 |
| Target 1 / 2 | 85.50 / 89.51 |
| Stop loss | 78.83 |
| Reward/risk | 1.5 / 3.0 |
Today's full Buy and Sell list for US stocks →
Disclaimer: This technical analysis is generated automatically from exchange data and indicators calculated by JournalArta, for information and education only. The verdict and the entry, target and stop-loss levels are not investment advice or a solicitation to buy or sell any security. Investment decisions and their risks rest solely with the reader.
Track XEL stock price daily: live levels, support/resistance and our full XEL analysis history.