BRBY Share Price on Tuesday: Slides 3.53%, Up 3% in Five Sessions
Technical analysis of BRBY stock on November 17, 2026: price 1,135.00 GBp, trend uptrend, RSI 57.2, support 1,036.50, resistance 1,185.00.
Why BRBY is in focus today
- One-day move of 0.00%, about 0.0× its average daily range (ATR)
Selected automatically from 10 LSE (UK) stocks by a technical-signal score with daily weighted randomisation — not a recommendation.
Trend & Price Action
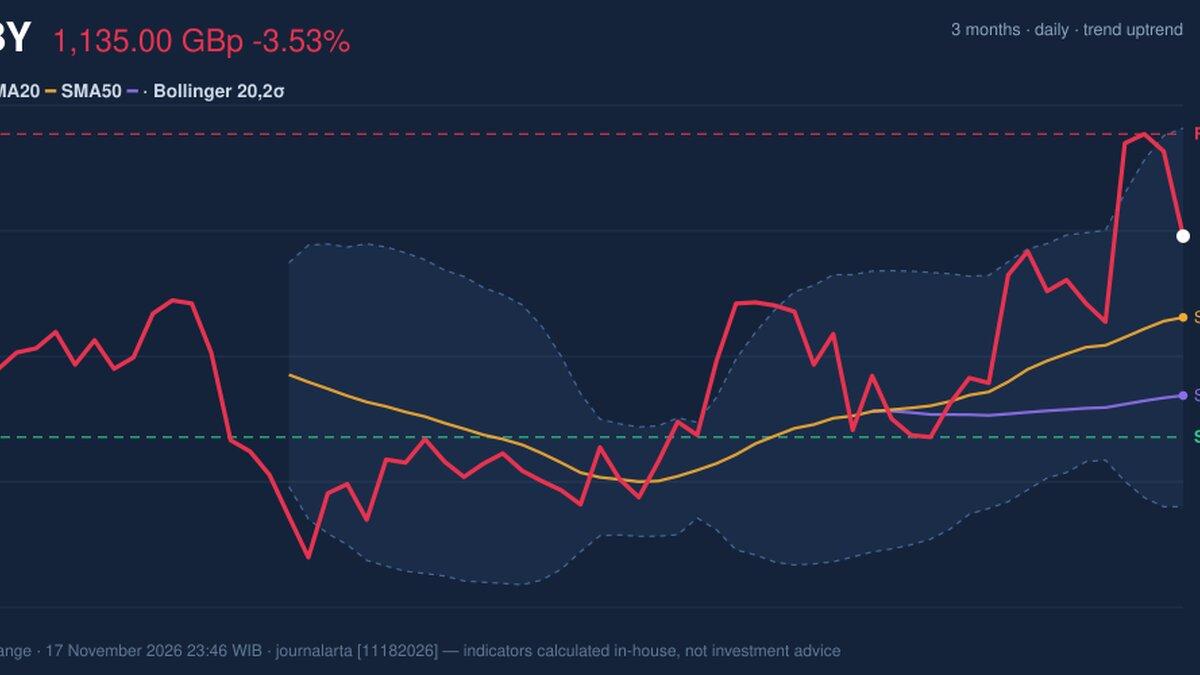
The structure is clean. Burberry trades above both its 20-day and 50-day averages, the 20-day average has risen 1.35% over the past five sessions, and the stock sits in the upper two-thirds of its 20-day range — at 66% of the distance between support at 1,036.50 and resistance at 1,185.00. No golden or death cross formed in Tuesday's session, so the moving-average alignment is simply carrying over from earlier in the move. The failed push at 1,185.00 is the part that matters. Buyers had a second attempt at that ceiling in as many days and were turned back. A short, punchy read: the stock is resting on its 20-day average, and that line has held all month.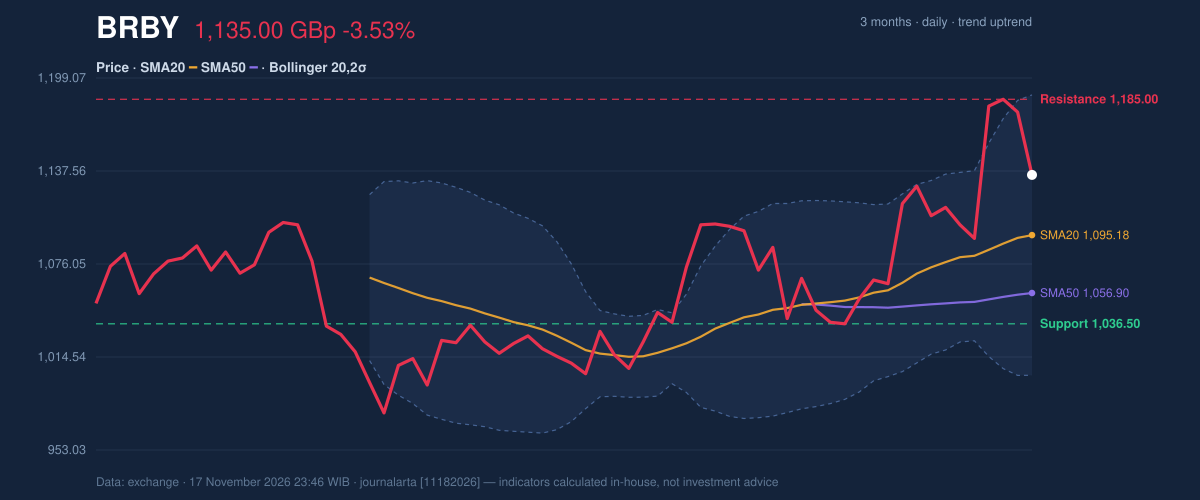
Note the selection signal behind Burberry's appearance on the JournalArta screen: Tuesday's move was recorded at roughly 0.0× the average daily range in the data feed — in other words, a flat measure despite the percentage fall, which is a quirk of how the signal is computed rather than a contradiction. What the price chart actually shows is a decisive red candle that still leaves the uptrend intact.
Oscillators & Momentum
Momentum is where the caution signs sit. The RSI(14) at 57.2 is squarely neutral — neither stretched nor weak — but the data flags it as rolling over from above 65, meaning it has come off a near-overbought reading. That is a bullish trend losing a little heat, not a trend breaking. The Stochastic adds nuance: %K at 61.5 against %D at 78.5 puts the faster line below the slower one, a short-term deterioration. Yet the MACD remains positive at 27.884 above its signal line at 20.859, with a histogram of 7.025 — momentum is still pointed upward on the medium-term gauge.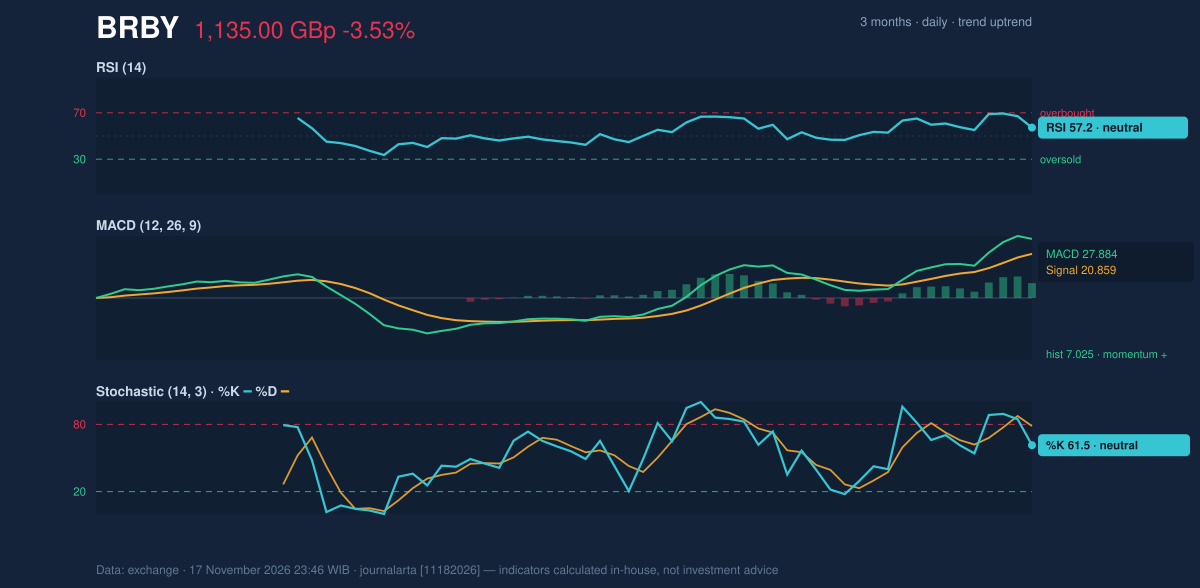
The reconciliation is straightforward: short-term oscillators are cooling while the MACD trend gauge has not flipped. Two of the three momentum measures agree the trend persists; the Stochastic is the odd one out.
Volatility & Volume
Risk is elevated. The ATR(14) of 42.05 equals 3.7% of the share price — high volatility, meaning the stock routinely covers wide ground in a session. That is exactly why a 3.5% single-day drop should not be read as a structural break on its own. Bollinger bands are behaving. The width of 16.9% is described as normal, not a squeeze, and %B at 71% puts the price in the upper band region — consistent with strength, not exhaustion at the ceiling. The upper band sits at 1,187.89, essentially coinciding with the 20-day resistance of 1,185.00; a close above that confluence would be the confirmation signal. The lower band is at 1,002.46. Volume offers the more interesting cue. Tuesday's 1,573,645 shares came in at 0.8× the 20-day average of 2,082,387 — the decline happened on thin participation, which weakens the case that sellers were pressing hard. Meanwhile OBV is rising, the data's second bullish signal, indicating accumulation has outrun distribution over the period. Price down on light volume, with OBV up, is the classic signature of a shakeout rather than a distribution top.Key Levels & Scenarios
Everything hangs on two lines. Support at 1,036.50 (the 20-day floor) is the first line of defence, with the 20-day average at 1,095.18 acting as a nearer guide. On the upside, resistance at 1,185.00 is the gate — and the three-month high of 1,204.00 sits just above it. If the price holds above 1,095.18 and reclaims 1,185.00, the path toward the 1,204.00 high reopens. If it loses 1,036.50, the next reference is the 50-day average at 1,056.90 — note that the two are close, so a break of 1,036.50 would almost certainly test the 50-day line. The three-month low of 953.40 is the deeper backstop.Technical Verdict: BUY
The JournalArta research model scores Burberry at +76 on a −100 to +100 scale, comfortably above the +60 buy threshold. Three reasons carry the call: - Price above the 50-day average at 1,056.90, with the 20-day average above the 50-day — a textbook rising structure. - MACD positive at 27.884 over its 20.859 signal, and RSI at 57.2 sitting in the constructive 50–70 zone rather than overbought territory. - OBV rising confirms participation behind the uptrend, and Tuesday's pullback came on below-average volume (0.8× normal). The invalidation condition: the verdict fails if the price breaks below the stop loss at 1,063.60. The risk worth naming is the RSI rolling over from above 65 — if that deterioration accelerates, the pullback deepens before the trend reasserts. - Entry zone: 1,103.51 – 1,135.00 - Target 1: 1,242.10 - Target 2: 1,349.20 - Stop loss: 1,063.60 - Reward/risk: 1.5 (target 1) to 3.0 (target 2), valid until 15 December 2026 In plain English: the trend is still up, the dip looks like profit-taking on light volume, and the setup favours patient accumulation over panic — provided 1,063.60 holds. This is technical analysis, not investment advice. The next scheduled checkpoint is the model's validity date of 15 December 2026; until then, watch whether Burberry can convert its 20-day average into a launchpad back toward the 1,185.00 ceiling.Summary Data BRBY
| Last price | 1,135.00 GBp |
| Change 1 day / 5 days / 1 month | -3.53% / 2.99% / 3.37% |
| Trend / MA-cross | uptrend / none |
| SMA20 / SMA50 | 1,095.18 / 1,056.90 |
| RSI (14) / Stochastic %K | 57.2 / 61.5 |
| Bollinger %B / ATR | 71% / 42.05 |
| Support / Resistance 20 days | 1,036.50 / 1,185.00 |
| Data as of | 17 November 2026 23:46 WIB |
| JournalArta research verdict (score) | Buy (+76) |
| Entry zone | 1,103.51 – 1,135.00 |
| Target 1 / 2 | 1,242.10 / 1,349.20 |
| Stop loss | 1,063.60 |
| Reward/risk | 1.5 / 3.0 |
Today's full Buy and Sell list for UK, Singapore & Hong Kong stocks →
Disclaimer: This technical analysis is generated automatically from exchange data and indicators calculated by JournalArta, for information and education only. The verdict and the entry, target and stop-loss levels are not investment advice or a solicitation to buy or sell any security. Investment decisions and their risks rest solely with the reader.
 Take the quizWhat Kind of Holiday Spender Are You? Take the Black Friday QuizStart →
Most Read
- 1U.S. Emergency Alert Test Nov. 17 Is Not a Power Outage

- 2DUP Chairman Lord Morrow Loses Wife and Daughter Within Hours in NI

- 3NASA’s Curiosity Rover Burst Open a Rock and Found Pure Sulfur

- 4Women With Autoimmune Diseases Wait About 4 Years for Diagnosis, Study Finds

- 5Stock Market Today: Dow Futures Slip as Nasdaq Futures Climb Before Earnings

Don't Miss
 Lifestyle7 Signs Your Social Battery Is Running Low (and Why You Keep Cancelling Plans)
 Lifestyle · Food & HealthThanksgiving Food Safety: How Long Leftovers Last and the Safe Turkey Temperature
 Lifestyle7 Quiet Habits of Emotionally Intelligent People, According to Psychologists
 LifestylePeople Who Don’t Like Celebrating Their Birthday Often Share These 7 Traits