Severn Trent Share Price Falls 1.20%: Up 3% in a Month
Technical analysis of Severn Trent stock on November 17, 2026: price 3,304.00 GBp, trend uptrend, RSI 57.4, support 3,212.00, resistance 3,350.00.
Why Severn Trent is in focus today
Selected automatically from 10 LSE (UK) stocks by a technical-signal score with daily weighted randomisation — not a recommendation.
Trend & Price Action
The structure here is textbook uptrend with a shallow dip. The 20-day average has risen 1.07% over the past five days, confirming that the medium-term bias is still upward even as the share price eases off recent highs. The stock sits about 67% of the way through its 20-day range of 3,212.00 GBp support to 3,350.00 GBp resistance, and remains about 2.3% below its three-month high of 3,382.00 GBp while sitting more than 14% above the three-month low of 2,888.00 GBp.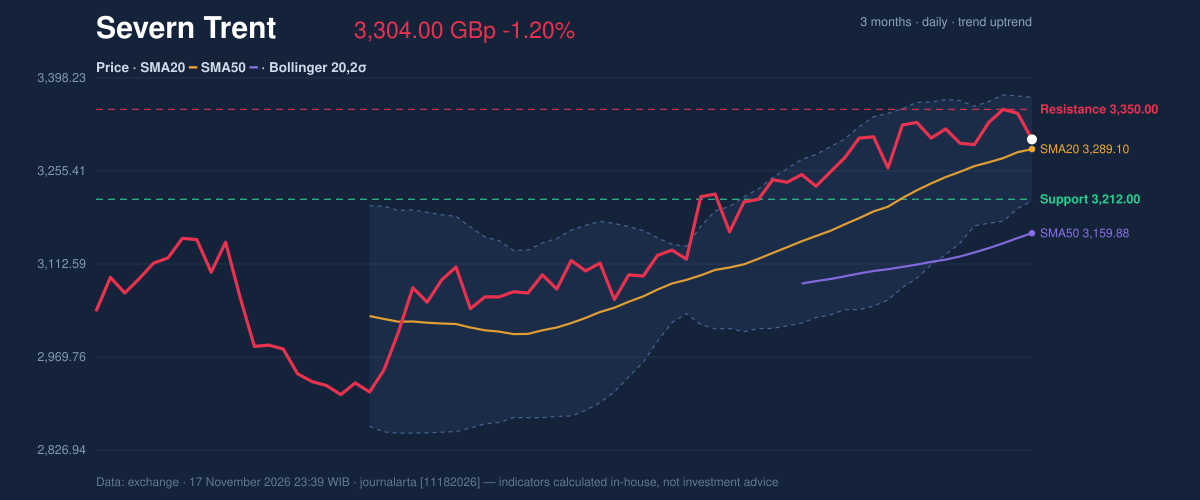
Oscillators & Momentum
Momentum is the softer part of the picture. RSI(14) at 57.4 sits in neutral territory — neither stretched nor weak — but the signal set flags it as rolling over from above 65, a classic early warning that buying pressure is easing. Stochastic %K at 43.5 against %D at 68.3 shows the faster line already below the slower one, a short-term bearish crossover that aligns with the recent price dip.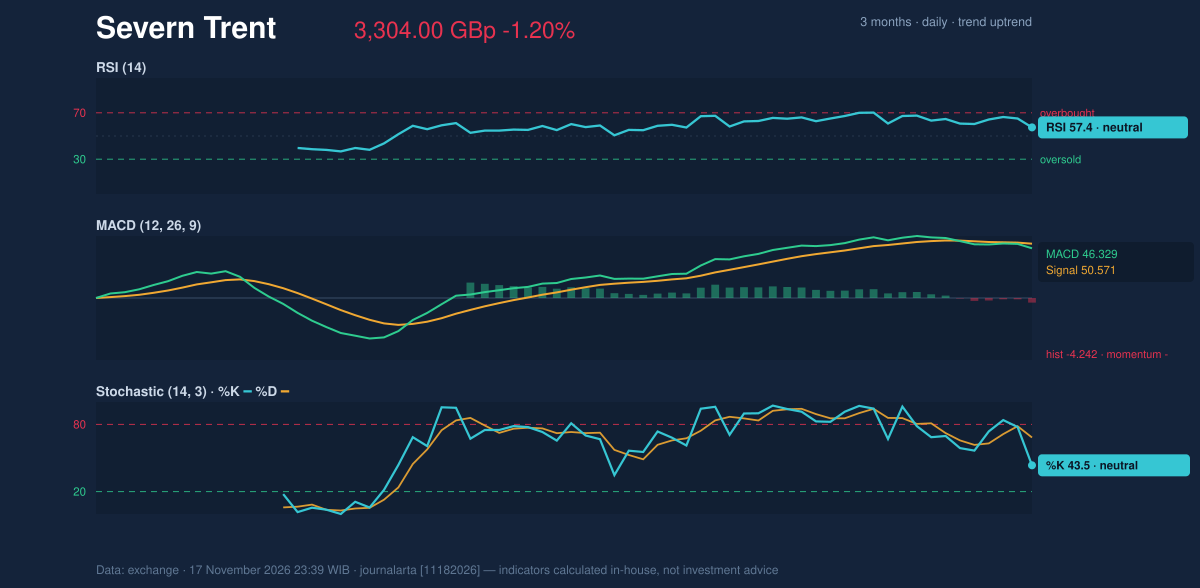
Volatility & Volume
Volatility is moderate, with ATR(14) at 54.50 GBp, about 1.6% of the share price — a daily range that is meaningful but not disorderly for a large-cap utility. The more interesting signal is in the Bollinger Bands: the width is just 4.8%, described as narrowing (a squeeze), with %B at 59%. A squeeze means the price has been coiling within a tightening range; historically that condition precedes a larger directional move once the range resolves, though it does not dictate which way. Given the price sits in the upper half of the bands but below the upper band of 3,368.44 GBp, the setup leans toward an upside resolution if the resistance at 3,350.00 GBp gives way. Volume supports that lean. On-balance volume is rising, meaning cumulative buying pressure is still building even as the share price dips — a divergence that typically signals accumulation rather than abandonment. The 1.2× normal volume on a down day is worth watching: if it persists on further weakness, the accumulation read weakens.Key Levels & Scenarios
The immediate battleground is the 3,350.00 GBp resistance, which sits just below the three-month high of 3,382.00 GBp. A close above resistance would open the path toward that high, and the narrowing Bollinger range suggests such a break could come with follow-through. On the downside, the 3,212.00 GBp support is the first line of defence; the 20-day average at 3,289.10 GBp sits between price and that support and is the level a shallow pullback would normally test and hold. If the price fails to hold the 20-day average on a closing basis, the bias shifts toward a retest of support; if support fails, the 50-day average at 3,159.88 GBp becomes the structural line in the sand. The reward-to-risk framing from the signal set is 1.5 to 3.0, which reflects a setup where the upside targets sit meaningfully above the stop level.Technical Verdict: BUY
The evidence tilts constructive, and the JournalArta research verdict is BUY with a score of +76 on a −100 to +100 scale, driven by price above the 50-day average, the 20-day average above the 50-day, an established uptrend, and RSI in the 50–70 zone. - Entry Range: 3,263.12 – 3,304.00 GBp - Exit Target 1: 3,458.36 GBp - Exit Target 2: 3,612.73 GBp - Stop Loss: 3,201.09 GBp - Validity: through 15 December 2026 The strongest supporting reasons are the intact trend structure — price above both averages with the 20-day rising — and the rising OBV, which says buyers are still accumulating into weakness. The main risk is the negative MACD histogram (−4.242) and the RSI rolling over from above 65, which could extend the pullback toward the entry zone. The verdict is invalidated if price breaks below 3,201.09 GBp, the stop level that sits just under the 20-day support. In plain terms: the trend is still up and buyers are still present, but momentum is cooling, so this is a setup to watch for stabilisation rather than a clean breakout — and the squeeze in the Bollinger Bands means the next decisive move, whichever direction, is likely to be sharp.Summary Data Severn Trent
| Last price | 3,304.00 GBp |
| Change 1 day / 5 days / 1 month | -1.20% / 0.18% / 2.99% |
| Trend / MA-cross | uptrend / none |
| SMA20 / SMA50 | 3,289.10 / 3,159.88 |
| RSI (14) / Stochastic %K | 57.4 / 43.5 |
| Bollinger %B / ATR | 59% / 54.50 |
| Support / Resistance 20 days | 3,212.00 / 3,350.00 |
| Data as of | 17 November 2026 23:39 WIB |
| JournalArta research verdict (score) | Buy (+76) |
| Entry zone | 3,263.12 – 3,304.00 |
| Target 1 / 2 | 3,458.36 / 3,612.73 |
| Stop loss | 3,201.09 |
| Reward/risk | 1.5 / 3.0 |
Today's full Buy and Sell list for UK, Singapore & Hong Kong stocks →
Disclaimer: This technical analysis is generated automatically from exchange data and indicators calculated by JournalArta, for information and education only. The verdict and the entry, target and stop-loss levels are not investment advice or a solicitation to buy or sell any security. Investment decisions and their risks rest solely with the reader.
Track Severn Trent share price daily: live levels, support/resistance and our full Severn Trent analysis history.
 Take the quizWhat Kind of Holiday Spender Are You? Take the Black Friday QuizStart →
- 1U.S. Emergency Alert Test Nov. 17 Is Not a Power Outage

- 2DUP Chairman Lord Morrow Loses Wife and Daughter Within Hours in NI

- 3NASA’s Curiosity Rover Burst Open a Rock and Found Pure Sulfur

- 4Women With Autoimmune Diseases Wait About 4 Years for Diagnosis, Study Finds

- 5Stock Market Today: Dow Futures Slip as Nasdaq Futures Climb Before Earnings

 Lifestyle7 Signs Your Social Battery Is Running Low (and Why You Keep Cancelling Plans)
 Lifestyle · Food & HealthThanksgiving Food Safety: How Long Leftovers Last and the Safe Turkey Temperature
 Lifestyle7 Quiet Habits of Emotionally Intelligent People, According to Psychologists
 LifestylePeople Who Don’t Like Celebrating Their Birthday Often Share These 7 Traits