Booking (BKNG) Stock Slides 3.89% on Thursday, Near a 3-Month Low
Technical analysis of BKNG stock on November 19, 2026: price 147.32 USD, trend downtrend, RSI 36.4, support 147.32, resistance 170.97.

Why BKNG is in focus today
- One-day move of 0.00%, about 0.0× its average daily range (ATR)
Selected automatically from 11 NASDAQ (US) stocks by a technical-signal score with daily weighted randomisation — not a recommendation.
Trend and price structure: a downtrend with no counterweight
The structural picture is unambiguously bearish. The last price sits below both the 20-day average of $156.59 and the 50-day average of $160.49, and the 20-day average itself is falling 1.18% over five days — a slope that confirms the trend is still leaning lower rather than flattening. There is no fresh moving-average crossover in the data, which matters: no golden cross signal exists to argue for a reversal, and the standing configuration of the 20-day average beneath the 50-day average is the textbook definition of a downtrend. Price is at 0% of its 20-day range, pinned to the floor between the $147.32 support and the $170.97 resistance above. That positioning is the key signal: in a healthy uptrend, a stock at the bottom of its range is a buying opportunity; in a confirmed downtrend — price below the 50-day, averages sloping down — it is a warning that the range floor is being tested, not defended.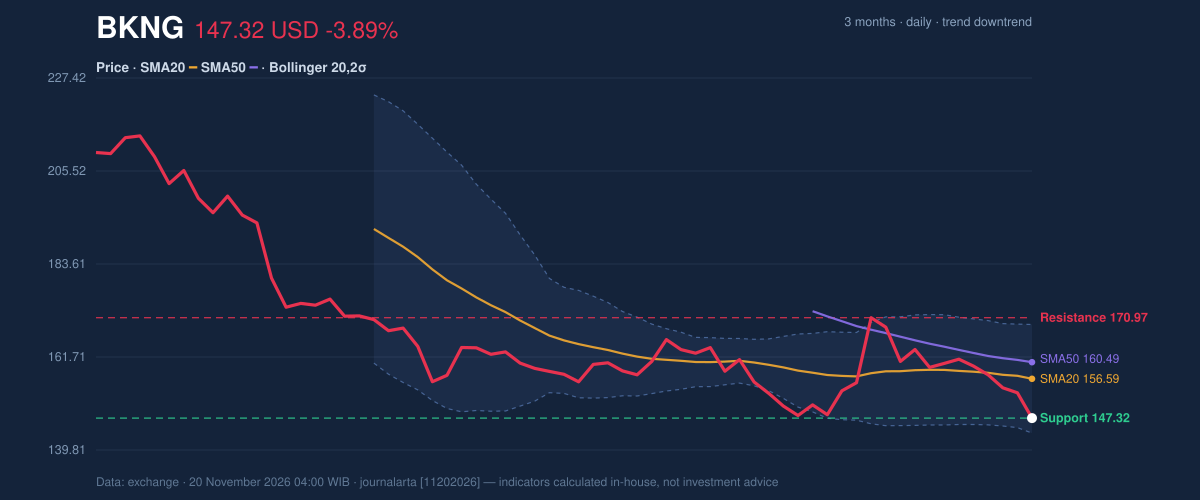
Oscillators and momentum: oversold, but not yet exhausting
Momentum indicators tell a story of selling pressure that is stretched but still in force. RSI(14) at 36.4 sits in neutral territory, not yet at the classic 30 oversold threshold, so there is room for further downside before the oscillator itself signals capitulation. The stochastic is more extreme: %K at 0.3 against %D at 16.4 — a near-total washout of short-term buying interest that has already produced a bearish crossover. The divergence between a still-neutral RSI and a fully oversold stochastic is worth naming precisely: the fast oscillator has already capitulated while the slower one has not. Historically that combination often produces sharp but short-lived bounces rather than durable turns — and here, any bounce would run directly into the 20-day average at $156.59, a level the stock has not reclaimed since the slide began. MACD confirms the bearish alignment: the line at -2.296 is below its signal at -1.677, and the histogram at -0.619 has just turned negative, per the computed signals. Momentum is accelerating downward, not decaying.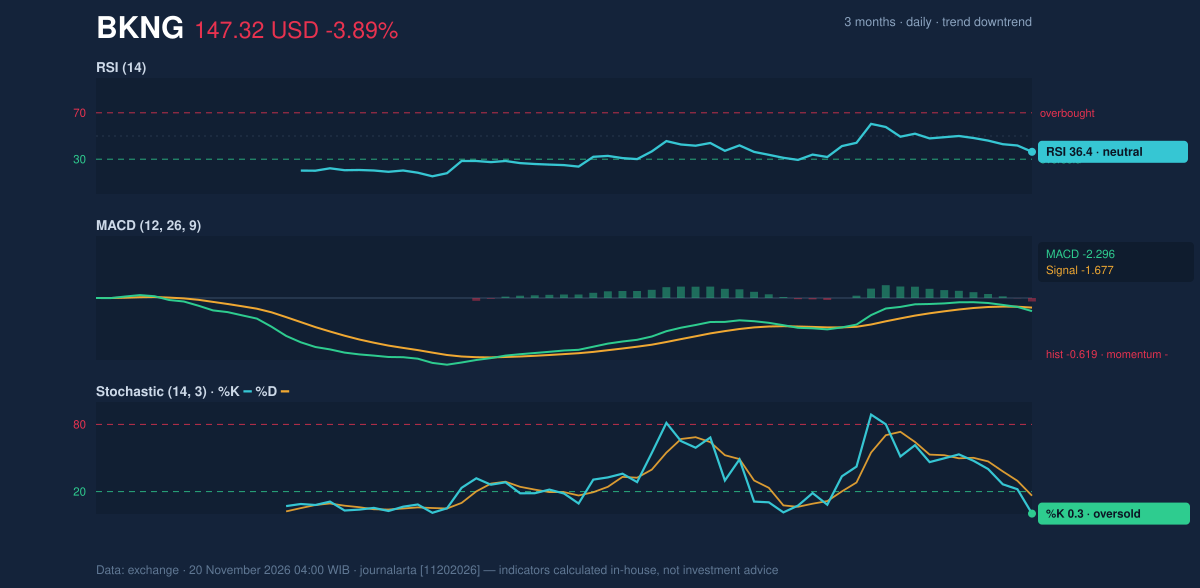
Volatility and volume: the lack of conviction cuts both ways
ATR(14) at $6.96 — 4.7% of the last price — flags elevated volatility, meaning a single ordinary session can move the stock several dollars without changing the narrative. Bollinger bands frame the risk: the lower band sits at $143.79, the upper at $169.38, with a band width of 16.3% that is normal rather than a squeeze. %B at 14% places the price in the bottom sixth of the envelope — close to the lower band, which in a downtrend usually acts as a ceiling for bounces rather than a floor. Volume at 6.67 million shares was below the 20-day average of about 7.50 million, and the on-balance-volume line is falling. That combination — a falling OBV on declining volume — is the signal that matters most: distribution is orderly, not panicked. The absence of heavy selling is not reassurance; it is evidence that there is no rush to buy the dip.Fundamental context and key levels
For context, Booking Holdings reported quarterly revenue of $8.89 billion for the quarter ended 30 September 2026, down 1.3% from $9.01 billion a year earlier, according to its SEC filing on 3 November. Net income of $2.72 billion and diluted earnings of $3.61 per share were also slightly below the prior year. The company then filed a Form 8-K on 13 November reporting a material definitive agreement and other material events — a filing that, combined with the softer top line, helps explain why the technical weakness has not been met with buyers. The levels now define the scenarios. A break and close below $147.32 opens the path toward the next computed objectives at $129.58 and $111.83, with the three-month low of $146.28 as the immediate tripwire. Any recovery must reclaim $156.59 — the 20-day average — to suggest the downtrend is bending, and $159.15 to invalidate the bearish case outright. A failure at the current floor, by contrast, would confirm that the range bottom was never support at all.Technical Verdict: SELL
The evidence converges. Price below both the 20-day and 50-day averages, with the 20-day average falling 1.18% over five days, establishes the primary trend. MACD’s histogram has just turned negative while the stochastic sits at an extreme 0.3, and falling OBV on below-average volume shows no institutional bid emerging. The computed score of −84 on JournalArta’s −100 to +100 scale reflects zero bullish against three bearish signals. - Entry / sell zone: $147.32 – $152.53 - Exit / targets: $129.58 (target 1), $111.83 (target 2) - Stop loss: $159.15 - Reward/risk: 1.5 / 3.0; setup valid until 18 December 2026 - Invalidation: a close above $159.15 breaks the bearish thesis In plain terms: the stock is sliding within a well-defined downtrend, sitting on its last line of support, and the momentum readings suggest the sellers still hold the initiative. As one trader watching the session put it, “the quiet ones are the dangerous ones — nobody’s fighting for it here.”Summary Data BKNG
| Last price | 147.32 USD |
| Change 1 day / 5 days / 1 month | -3.89% / -8.61% / -8.55% |
| Trend / MA-cross | downtrend / none |
| SMA20 / SMA50 | 156.59 / 160.49 |
| RSI (14) / Stochastic %K | 36.4 / 0.3 |
| Bollinger %B / ATR | 14% / 6.96 |
| Support / Resistance 20 days | 147.32 / 170.97 |
| Data as of | 20 November 2026 04:00 WIB |
| JournalArta research verdict (score) | Sell (-84) |
| Sell zone | 147.32 – 152.53 |
| Target 1 / 2 | 129.58 / 111.83 |
| Stop loss | 159.15 |
| Reward/risk | 1.5 / 3.0 |
Disclaimer: This technical analysis is generated automatically from exchange data and indicators calculated by JournalArta, for information and education only. The verdict and the entry, target and stop-loss levels are not investment advice or a solicitation to buy or sell any security. Investment decisions and their risks rest solely with the reader.
Track BKNG stock price daily: live levels, support/resistance and our full BKNG analysis history.
 Take the quizWhat Kind of Holiday Spender Are You? Take the Black Friday QuizStart →
Most Read





Don't Miss
 Lifestyle · Food & HealthNormal Blood Pressure Chart by Age: Healthy Ranges Explained
 Lifestyle · Food & HealthWhat Is Raynaud’s Syndrome? Why Fingers Turn White in the Cold
 Lifestyle · Food & Health4 Ways Walking After Meals Helps Your Body, Doctors Say
 Lifestyle · Food & Health4 Reasons to Eat Oatmeal, According to Nutrition Experts