AMD Stock Week Ahead: Technical Outlook for November 16–20
AMD stock week ahead for November 16–20: last close 534.06 USD, weekly change 18.93%, support 404.40, resistance 585.30.
By matthew jonathan
November 14, 20265 min read
Logo Advanced Micro Devices — JournalArta illustration
AMD heads into the week of November 16–20 at $534.06, after a Friday drop of 8.75% that took back a large share of an otherwise explosive week.
Last Week in Review
The chipmaker's shares finished the week ended November 13 up 18.93%, from $449.04 on November 6 to $534.06. Four of five sessions closed higher.
The best came first. On November 9 the stock jumped 13.26% after opening the week at $473.39, and it set the week's low of $468.21 that same day. The high followed on November 12 at $594.00, a 26.87% range from bottom to top.
Then came Friday. The November 13 session was the worst of the week, at -8.75%, leaving the close at 52% of the weekly range.
Volume told the same story. Average daily turnover reached 49,773,520 shares, 1.80x the 27,590,350 average of the 20 sessions before the week.
Heavy trading on both the surge and the reversal means buyers and sellers were both active.
Advertisement
Technical Map for the Week Ahead
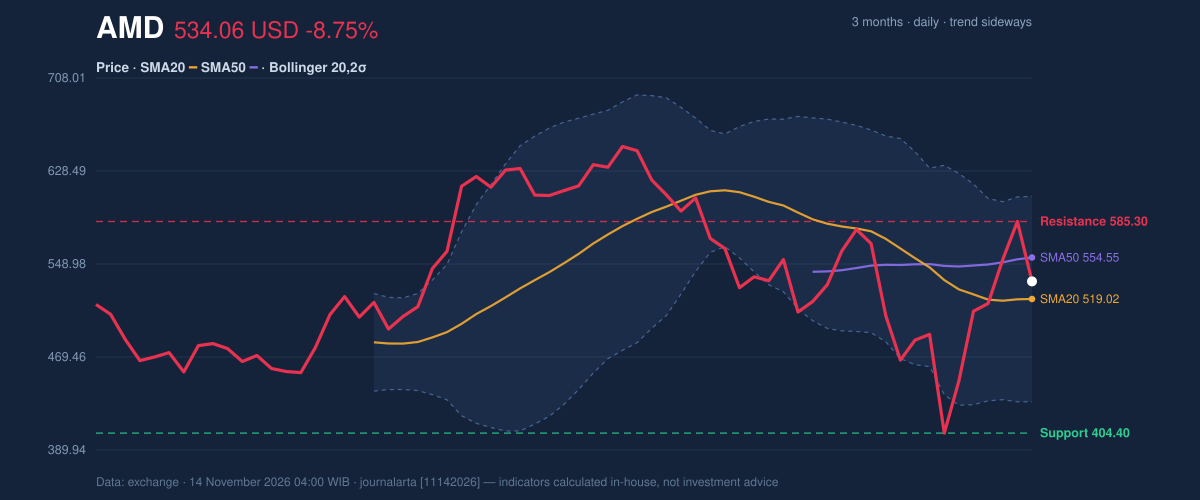
The 20-day trend reads sideways, with the SMA20 slope at -1.57% over five days. That figure describes the average, not the stock's price change. The price sits above the 20-day average of 519.02 but below the 50-day average of 554.55. No new moving-average crossover has formed.
3-month price action chart of AMD: price, SMA20/50, Bollinger, support & resistance.
Bollinger Bands show how wide the swings have become. The upper band is at 606.77, the middle at 519.02 and the lower at 431.27. The bands are widening and the stock sits at 59% of their range. ATR(14) is 47.88, or 9.0% of the price, so daily moves of this size are normal now.
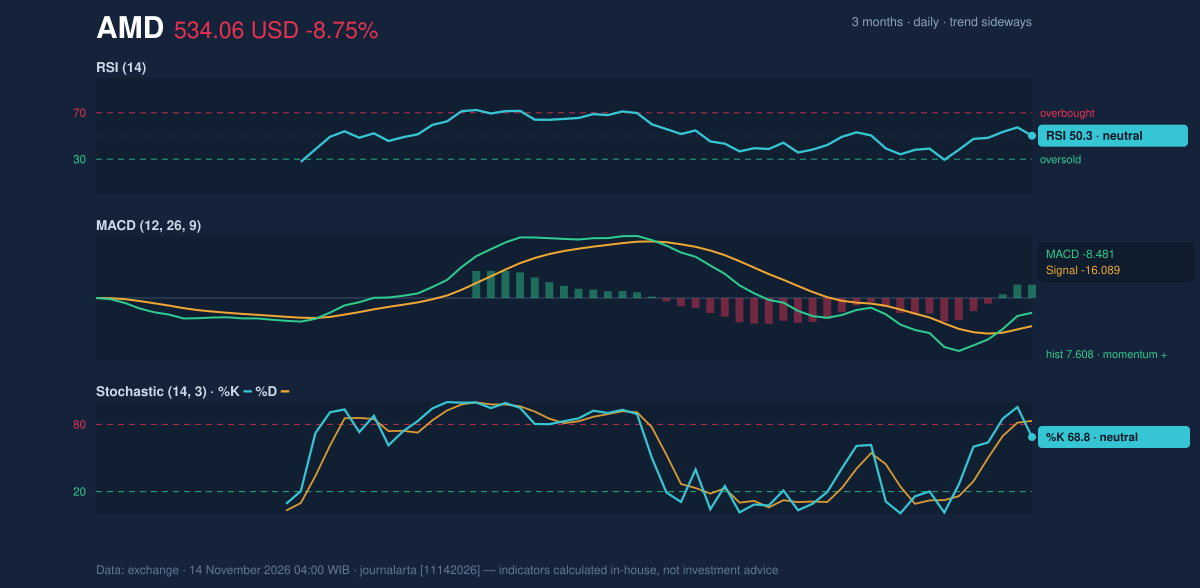
Momentum is mixed. RSI(14) is 50.3, neutral. Stochastic %K at 68.8 sits below %D at 83.1. MACD is still negative at -8.481 against a signal of -16.089, but the histogram has turned positive at 7.608. On-balance volume is rising.
Momentum chart of AMD: RSI(14), MACD, Stochastic.
Advertisement
The 20-day range runs from support at 404.40 to resistance at 585.30. The three-month range is 402.10 to 658.52.
Bullish scenario: if the stock closes above 585.30, the next reference points are the upper Bollinger Band at 606.77 and the price plus 1.5 times ATR at 605.88. Above those sits the three-month high of 658.52.
Bearish scenario: if it slips below the SMA20 at 519.02, the lower reference is price minus 1.5 times ATR at 462.24. A break below 404.40 would open the three-month low of 402.10.
Fundamentals and Catalysts
The company reported quarterly revenue of $13.38 billion for the quarter ended September 26, up 44.7% from $9.25 billion a year earlier, according to a Form 10-Q filed on November 4.
Net income was $2.43 billion, against $1.24 billion a year earlier. Diluted earnings per share came to $1.46.
AMD also filed a Form 8-K with the U.S. Securities and Exchange Commission on November 3, covering its results of operations and a Regulation FD disclosure.
On November 13, AMD and PsiQuantum expanded their partnership to co-design computing infrastructure, according to a company news listing.
The same day, AMD and other chip stocks slid as Wall Street rethought the AI trade, according to a market headline reported on November 13. That fits Friday's 8.75% fall, though the headline does not say what drove it.
No earnings or dividend dates for the coming week appear in the research.
Advertisement
Macro, Political and Global Factors
The research gathered for this analysis contains no verified macro, policy or global facts dated this week. None are assumed here. The only market-wide signal on record is the November 13 reassessment of AI-linked chip shares noted above.
Risks and What Would Invalidate the Scenario
The upside case weakens if the stock fails to hold the 519.02 SMA20, because the week's gain would then look like a spike rather than a base. Below that, 462.24 is the next reference, and the broader downside case needs a break of 404.40.
The downside case weakens if buyers push a close above 585.30, the level where Thursday's session ended before Friday's drop.
Volatility is the main risk. With ATR at 9.0% of the price and volume at 1.80x normal, a single headline can move the stock past either level in one session. The sector sentiment reported on November 13 adds to that. A reversal of the AI-trade rethink could swing the price either way.
Advertisement
Technical Verdict for the Week: HOLD (wait & see)
The JournalArta research score is -20 on a scale of -100 to +100. A Buy needs +60 or above and a Sell needs -60 or below, so the call is HOLD (wait & see).
Three indicators support it:
- Trend and momentum disagree. The price is below the 50-day average of 554.55 and the 20-day average is below the 50-day, while the MACD histogram has just turned positive at 7.608.
- RSI is neutral at 50.3, after a five-day gain of 18.93% that has already been partly reversed.
- Signals cancel out. One bullish signal (the MACD histogram turn) offsets one bearish signal (a bounce into the SMA20 inside a downtrend).
The verdict is invalidated if the price closes above 585.30 or breaks below 404.40.
Conditional levels, drawn only from the reference levels:
- Upside scenario entry range: a close above 585.30, up to the 594.00 weekly high
- Upside target: 605.88, with 606.77 as the upper Bollinger Band
- Upside stop loss: 519.02 (SMA20)
- Downside scenario entry range: a break below 404.40
- Downside target: 402.10 (three-month low)
- Downside stop loss: 462.24 (price minus 1.5 times ATR)
In plain terms, the chart does not yet show a clear direction after a volatile week, so waiting for a decisive move beyond either level is the cautious reading.
AMD's newest development is the expanded PsiQuantum partnership, announced on November 13, the same day chip stocks fell.
Disclaimer: This technical analysis is generated automatically from exchange data and indicators calculated by JournalArta, for information and education only. The verdict and the entry, target and stop-loss levels are not investment advice or a solicitation to buy or sell any security. Investment decisions and their risks rest solely with the reader.