AVGO Stock Week Ahead: Technical Outlook for November 16–20
AVGO stock week ahead for November 16–20: last close 347.01 USD, weekly change 18.16%, support 291.53, resistance 364.36.
Nasdaq data showed Broadcom (AVGO) ending Friday, November 13, at $347.01, after a week that carried the stock sharply higher before a late pullback. Friday's session fell 4.76% from a prior close of $364.36. The stock enters the week of November 16–20 well above where it started, but off its highs.
Last Week in Review
AVGO gained 18.16% over the five sessions from November 9 to 13, rising from $293.69 at the November 6 close to $347.01. Four sessions rose and one fell.
The week opened at $305.29. Monday, November 9, was the best session, up 8.78%, and it also set the weekly low of $304.29. The weekly high of $369.82 came on Thursday, November 12. That put the weekly range at 21.54%, with the close sitting at 65% of it.
Thursday's move coincided with news reported on November 12 that Nvidia CEO Jensen Huang had resigned and that the board had named CFO Colette Kress interim chief executive. According to that report, AVGO jumped as much as 5% in the morning, and AMD rose about 5%.
Friday was the worst session. Average daily volume for the week reached 34,827,940 shares, about 1.46x the 23,893,660 average of the 20 sessions before it. Heavy volume on both the advance and the retreat suggests active repositioning.
Technical Map for the Week Ahead
The short-term trend reads sideways. The slope of the 20-day moving average is -0.35% over five days, which describes the average itself and not the stock's price change. Price sits above the SMA20 at $330.96 but still below the SMA50 at $345.38-adjacent territory, since the last close of $347.01 is only slightly above it. The 20-day average remains below the 50-day, so trend and momentum have not aligned.
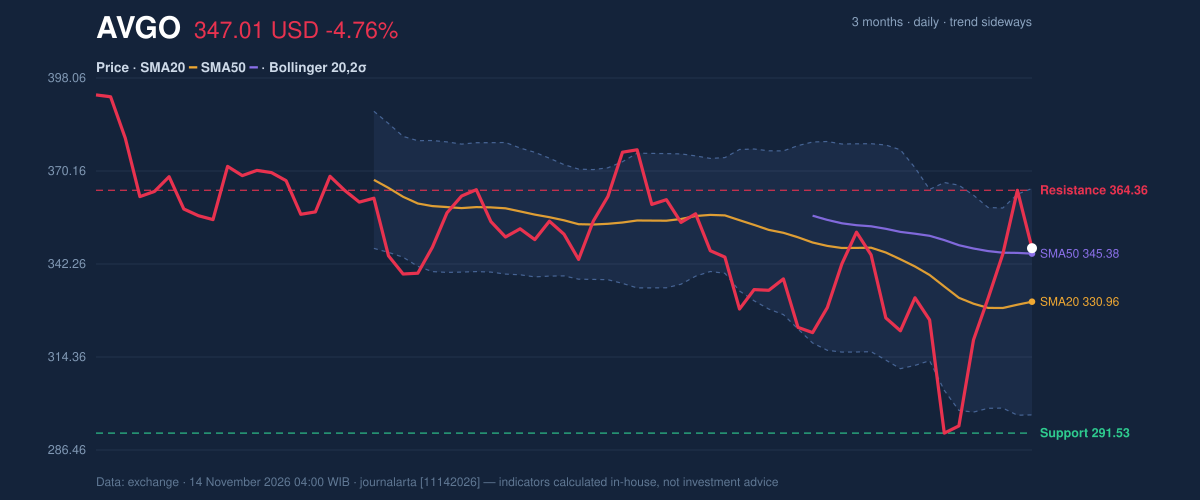
The chart shows the nearest ceiling at the 20-day resistance of $364.36, which is Thursday's close. The 20-day support is far lower, at $291.53. The three-month range runs from a low of $289.77 to a high of $412.50. Price sits at 76% of the 20-day range.
Bollinger Bands (20, 2σ) put the upper band at $364.92, the middle at $330.96 and the lower at $297.00. The %B reading is 74%, and the band width of 20.5% is expanding, a sign of high volatility. The 14-day ATR is $20.25, or 5.8% of the price, so daily swings of this size are normal.
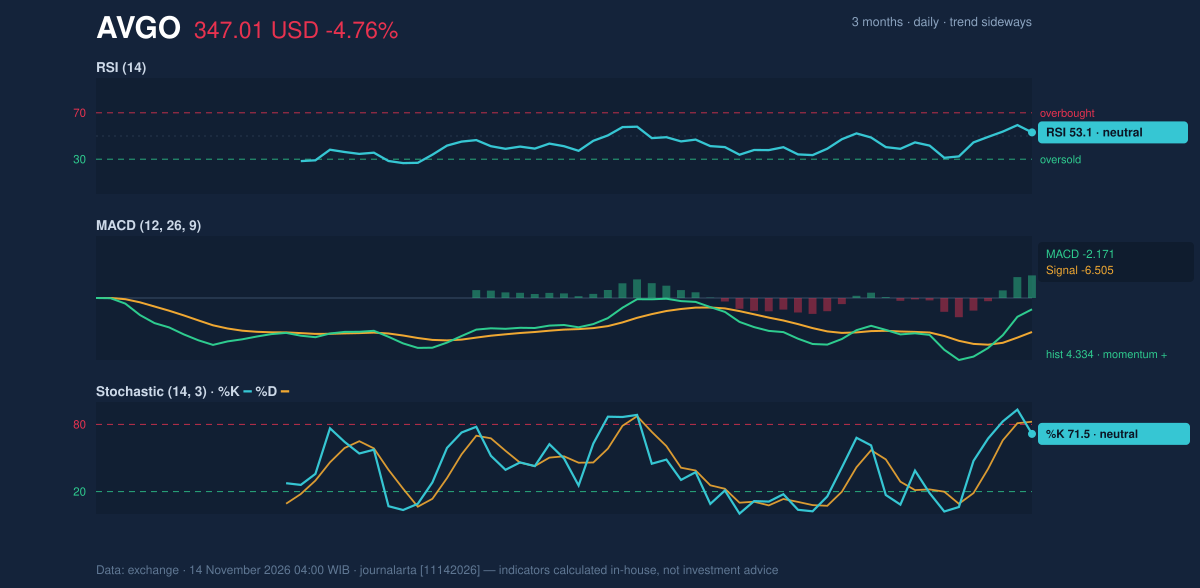
The momentum panel is mixed. RSI(14) is 53.1, neutral. Stochastic %K is 71.5 against %D at 82.4, also neutral. MACD is -2.171 against a signal line of -6.505, leaving a histogram of 4.334. That is positive momentum, even though the MACD line itself remains below zero. On-balance volume is rising, and Friday's volume of 31,602,000 was 1.2x the 20-day average of 26,849,330.
Bullish scenario: if AVGO closes above the 20-day resistance at $364.36, near the upper Bollinger Band at $364.92, the next reference is the ATR-based level of $377.38. Beyond that sits the three-month high of $412.50.
Bearish scenario: if the stock slips below the SMA20 at $330.96, the ATR-based level of $316.64 comes into view. A break of the 20-day support at $291.53 would test the three-month low of $289.77.
Fundamentals and Catalysts
Broadcom's Form 10-Q, filed on September 10, reported quarterly revenue of $29.59 billion for the quarter ended August 2, up 85.5% from $15.95 billion a year earlier. Net income was $13.09 billion, against $4.14 billion in the year-earlier quarter. Diluted earnings per share were $2.68.
Those figures show how much the earnings base has expanded, and they help explain why the stock draws attention when sector news breaks. The Nvidia leadership change reported on November 12 shows how quickly AVGO can move on news about a peer. The research available this week does not say whether that reaction will persist.
Macro, Political and Global Factors
The research block for this week contains no verified macro, policy or global facts about Broadcom. This analysis does not fill the gap with assumptions. Readers should check scheduled economic releases and company announcements for November 16–20 independently.
Risks and What Would Invalidate the Scenario
The bullish case weakens if AVGO fails to hold the SMA20 at $330.96 and drifts toward $316.64. Friday's 4.76% drop shows how quickly gains can reverse, and an ATR of 5.8% means a move of that size can recur within days.
The bearish case weakens if the stock closes above $364.36 and stays there. Such a close would also lift price above the upper Bollinger Band and bring the three-month high of $412.50 into play.
A further risk is event-driven. A move of up to 5% on a single headline about another company, as on November 12, can reverse as quickly as it appears. Volume at 1.46x the prior average adds to the uncertainty over whether buyers remain committed.
Technical Verdict for the Week: HOLD (wait & see)
The JournalArta research score is +36 on a scale from -100 to +100, short of the +60 needed for a buy call and well above the -60 sell threshold. The call is HOLD (wait & see), because trend and momentum have not yet aligned.
The strongest reasons:
- Price is above both the SMA20 ($330.96) and, narrowly, the SMA50 ($345.38), yet the 20-day average is still below the 50-day and trend is sideways.
- MACD histogram has turned positive at 4.334, but RSI at 53.1 is neutral and MACD itself is still below its signal line.
- Bollinger bands are widening at 20.5%, with ATR at 5.8% of price, so volatility is high.
Conditional scenario levels, taken only from DATA reference levels:
- Entry range (upside scenario): a close above $364.36, up to $377.38
- Target price: $412.50, the three-month high
- Stop loss: $330.96, the SMA20
- Downside scenario trigger: a break below $291.53, with $289.77 as the next reference
The verdict is invalidated if price closes above $364.36 or breaks below $291.53.
In plain terms: after a big weekly jump, the chart does not yet give a clear direction, so the data favors waiting for a decisive move. This is technical analysis, not investment advice.
AVGO Week Ahead Data
| Trading week | November 9 – November 13 (5 sessions) |
| Weekly change | 18.16% (293.69 → 347.01 USD) |
| Week high / low | 369.82 (November 12) / 304.29 (November 9) |
| Best / worst session | 8.78% (November 9) / -4.76% (November 13) |
| Avg daily volume vs prior 20 sessions | 34,827,940 vs 23,893,660 (1.46x) |
| SMA20 / SMA50 | 330.96 / 345.38 |
| RSI (14) / Stochastic %K | 53.1 / 71.5 |
| Support / Resistance 20 days | 291.53 / 364.36 |
| 3-month high / low | 412.50 / 289.77 |
| Week covered | November 16–20, 2026 |
| Data as of | 14 November 2026 04:00 WIB |
| JournalArta research verdict (score) | Hold (+36) |
Today's full Buy and Sell list for US stocks →
Disclaimer: This technical analysis is generated automatically from exchange data and indicators calculated by JournalArta, for information and education only. The verdict and the entry, target and stop-loss levels are not investment advice or a solicitation to buy or sell any security. Investment decisions and their risks rest solely with the reader.
Track AVGO stock price daily: live levels, support/resistance and our full AVGO analysis history.