Genting Singapore Stock Drops 0.82% on Tuesday, Testing Support Level
On October 13, 2026: price 0.61 SGD, trend sideways, RSI 36.1, support 0.61, resistance 0.63. technical analysis of genting singapore stock.
Why Genting Singapore is in focus today
- Volume at 1.6× the 20-day average
- Closed at a 20-day low (0.61)
- Trading near its 3-month low (0.60)
- MACD histogram has just turned negative
- Breaking out of a Bollinger squeeze (band width 2.9%)
Selected automatically from 16 SGX (Singapore) stocks by a technical-signal score with daily weighted randomisation — not a recommendation.
Trend & Price Action
Genting Singapore is trading below both its SMA20 at S$0.62 and SMA50 at S$0.63. The short-term average is sloping down, while there has been no recent crossover between the two averages. That leaves the broader picture sideways, but with price action leaning weak: the shares have fallen 3.20% over five days and 1.63% over one month. The stock sits at the bottom of its 20-day range, with S$0.61 support and S$0.63 resistance. It is also close to the three-month low of S$0.60, versus a high of S$0.68. The proximity to the low means support is being tested rather than confirmed. A hold at this level could mark a pause in the decline; a break would put the three-month floor into focus. As shown in the chart, the price is near the lower Bollinger Band, while the band width has narrowed to 2.9%. Bollinger Bands measure how far prices are spread around a moving average; a squeeze signals subdued recent volatility and the potential for a larger move, but it does not indicate which direction that move will take.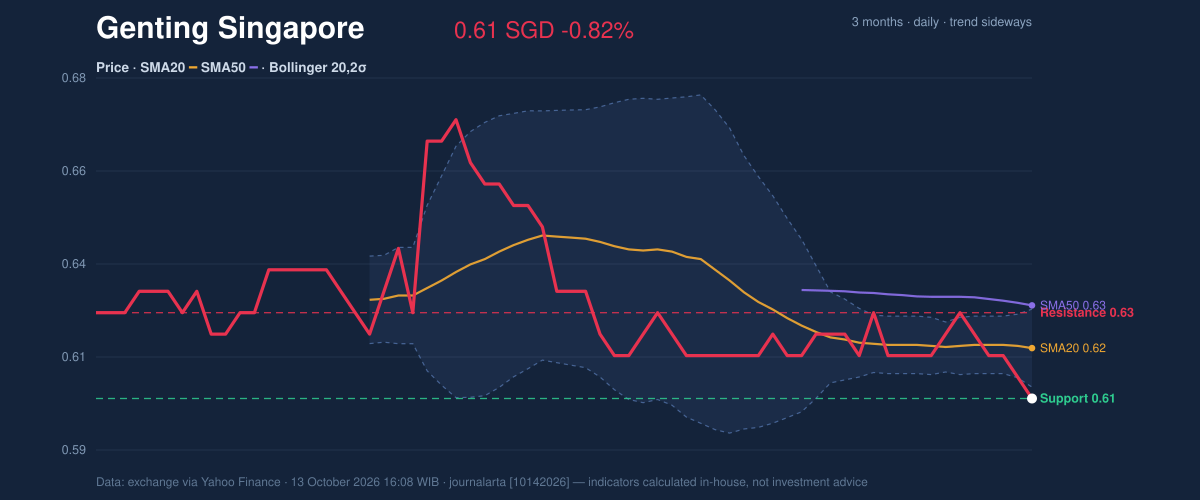
Oscillators & Momentum
Momentum indicators are mixed, but the short-term signals are fragile. The RSI is 36.1, a neutral reading that is below the midpoint of its scale but not, by itself, a confirmed oversold signal. The Stochastic is at 20.0 for both %K and %D, in oversold territory. That can mean selling has been persistent; it does not ensure prices will turn higher. The MACD reinforces caution. Its value and signal line are both -0.003, with a -0.001 histogram—the difference between the two lines—showing negative momentum. The recent shift of the histogram into negative territory suggests the weakening trend has gained traction, even as Stochastic readings hint that selling may be stretched. As shown in the chart, a stronger reversal case would require momentum to improve alongside price; an oversold reading alone is not confirmation.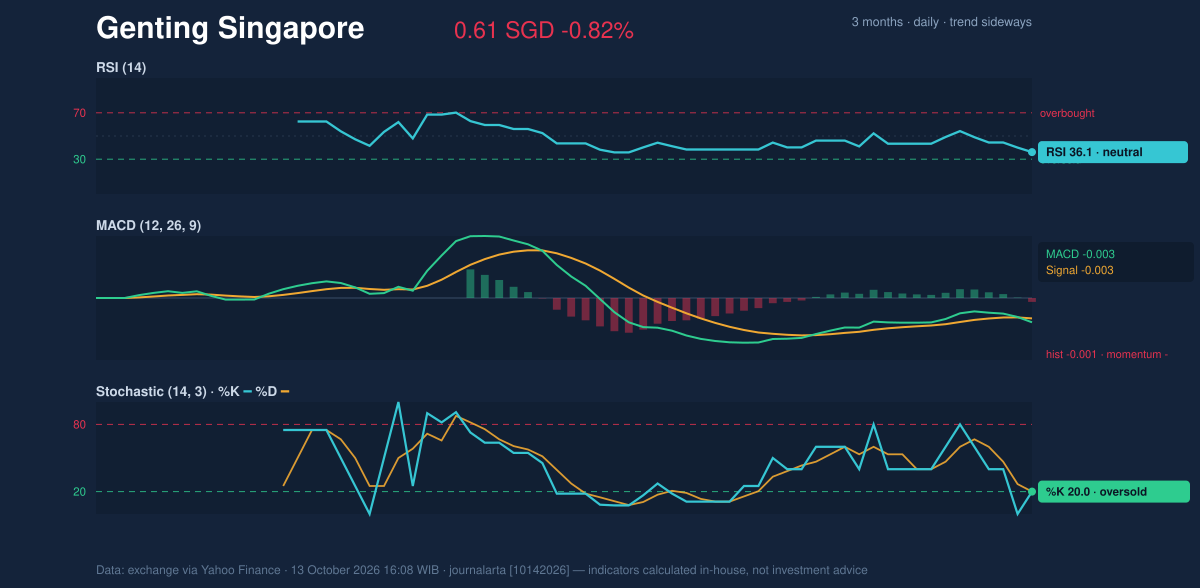
Volatility & Volume
The latest volume was 29,115,300 shares, compared with a 20-day average of 18,345,870. That is a notable increase in participation on a session that ended at the 20-day low. Volume can help distinguish an active move from a quiet drift, but the accompanying decline in OBV—the running measure of whether volume is heavier on rising or falling sessions—does not yet point to accumulation. The ATR is S$0.01, or 1.8% of the share price, indicating moderate recent volatility. With the Bollinger Bands squeezed, a move beyond the S$0.61–S$0.63 near-term range could carry more significance than a routine fluctuation inside it. The volume increase makes the next response around support especially important.Key Levels & Scenarios
The first test is S$0.61, the stated 20-day support and latest close. If it holds, the shares could attempt to recover toward S$0.62, where the SMA20 and Bollinger midpoint sit, then face resistance at S$0.63. A break below S$0.61 would weaken that case and expose the S$0.60 three-month low. Conversely, a move above S$0.63 would improve the short-term structure, though the available data do not establish that a breakout has occurred.Technical Verdict: HOLD
The technical reading supports a wait-and-see stance: price is near support, but momentum and volume-based evidence do not yet confirm a turn.- Reasons: price remains below the SMA20 and SMA50; the MACD histogram is negative; OBV is falling despite above-average volume.
- Entry range: S$0.61–S$0.62, conditional on support holding and price stabilising.
- Exit target: S$0.63, the 20-day resistance and SMA50 level.
- Stop-loss protection: S$0.60, aligned with the three-month low.
Summary Data Genting Singapore
| Last price | 0.61 SGD |
| Change 1 day / 5 days / 1 month | -0.82% / -3.20% / -1.63% |
| Trend / MA-cross | sideways / none |
| SMA20 / SMA50 | 0.62 / 0.63 |
| RSI (14) / Stochastic %K | 36.1 / 20.0 |
| Bollinger %B / ATR | -15% / 0.01 |
| Support / Resistance 20 days | 0.61 / 0.63 |
| Data as of | 13 October 2026 16:08 WIB |
Disclaimer: This technical analysis is generated automatically from exchange data (via Yahoo Finance) and indicators calculated by JournalArta, for information and education only. The verdict and the entry, target and stop-loss levels are not investment advice or a solicitation to buy or sell any security. Investment decisions and their risks rest solely with the reader.
Track Genting Singapore share price daily: live levels, support/resistance and our full Genting Singapore analysis history.