CICT Stock Drops 0.45%, Testing Support Level In Focus
On October 13, 2026: price 2.22 SGD, trend downtrend, RSI 35.8, support 2.22, resistance 2.29. technical analysis of cict stock. CICT Stock Drops — full…
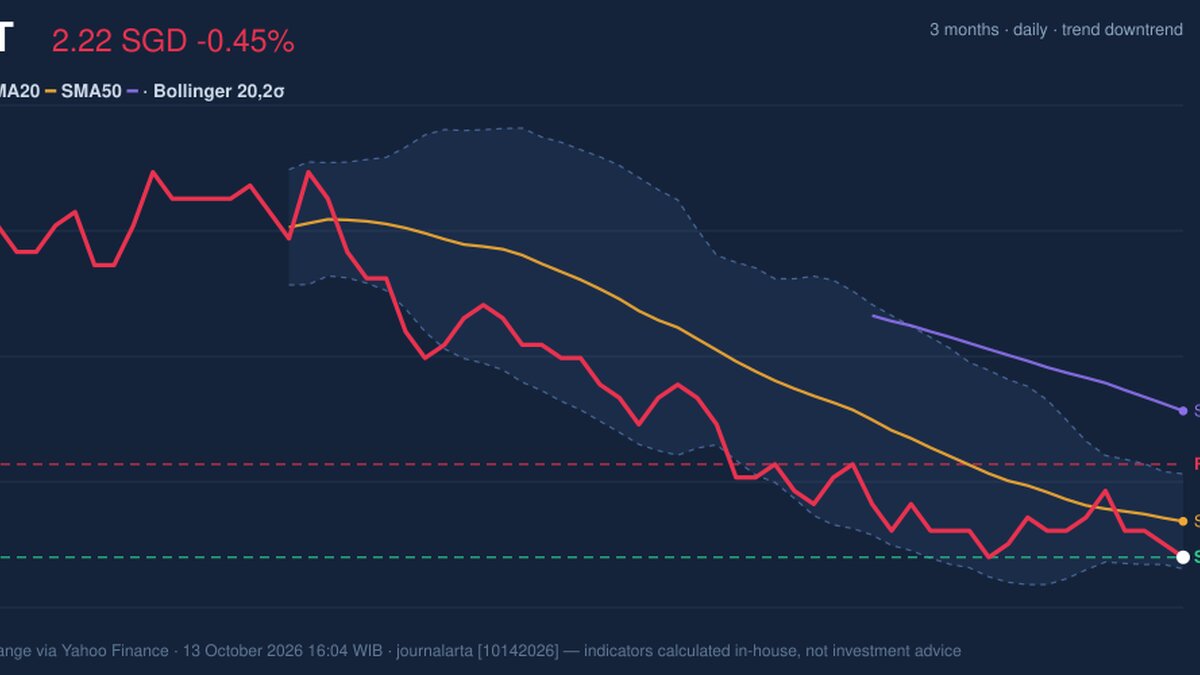
Why CICT is in focus today
- Closed at a 20-day low (2.22)
- Trading near its 3-month low (2.21)
- Downtrend extending (5-day change -1.33%)
- Not covered by JournalArta in the last 14 days
Selected automatically from 16 SGX (Singapore) stocks by a technical-signal score with daily weighted randomisation — not a recommendation.
Trend & Price Action
CICT closed at 2.22 SGD, down from the previous close of 2.23 SGD. Its price is below both the 20-day simple moving average (SMA20), at 2.25 SGD, and the 50-day average, at 2.33 SGD. A simple moving average smooths recent prices to show the direction of a trend; being below both suggests sellers still have the stronger position. The SMA20 is also sloping down, falling 0.53% over five days. No new moving-average crossover has formed to signal a change in direction. The close sits at the bottom of the 20-trading-day range, with support at 2.22 SGD and resistance at 2.29 SGD. It is also close to the three-month low of 2.21 SGD, compared with a high of 2.53 SGD. That proximity makes the lower band of recent prices especially important: holding near 2.22 would suggest selling pressure is meeting demand, while a break below it would put the three-month floor in focus. As shown in the chart, CICT is pressed against the lower Bollinger Band at 2.21 SGD, with the middle band at 2.25 SGD and the upper band at 2.28 SGD.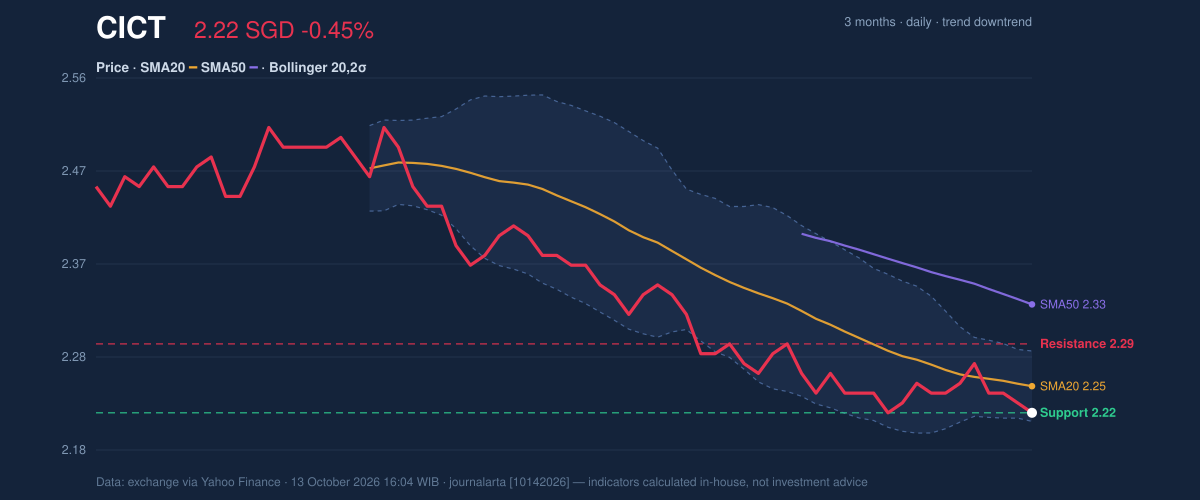
Oscillators & Momentum
The short-term indicators are mixed rather than aligned. The RSI is 35.8, in neutral territory; the Relative Strength Index gauges the speed of recent price moves, and this reading does not yet show an oversold condition. By contrast, the Stochastic is oversold, with %K at 11.1 and %D at 22.2. That can occur when a price has fallen sharply within its recent range, but it is not, by itself, proof that the decline has ended. The MACD histogram is positive at 0.004, while the MACD line at -0.025 remains below zero and the signal line at -0.029. The histogram measures the gap between those lines; its positive reading points to improving short-term momentum, but the negative levels show that the broader momentum picture has not turned convincingly positive. In plain terms, selling may be losing some force, yet the price trend has not confirmed a reversal.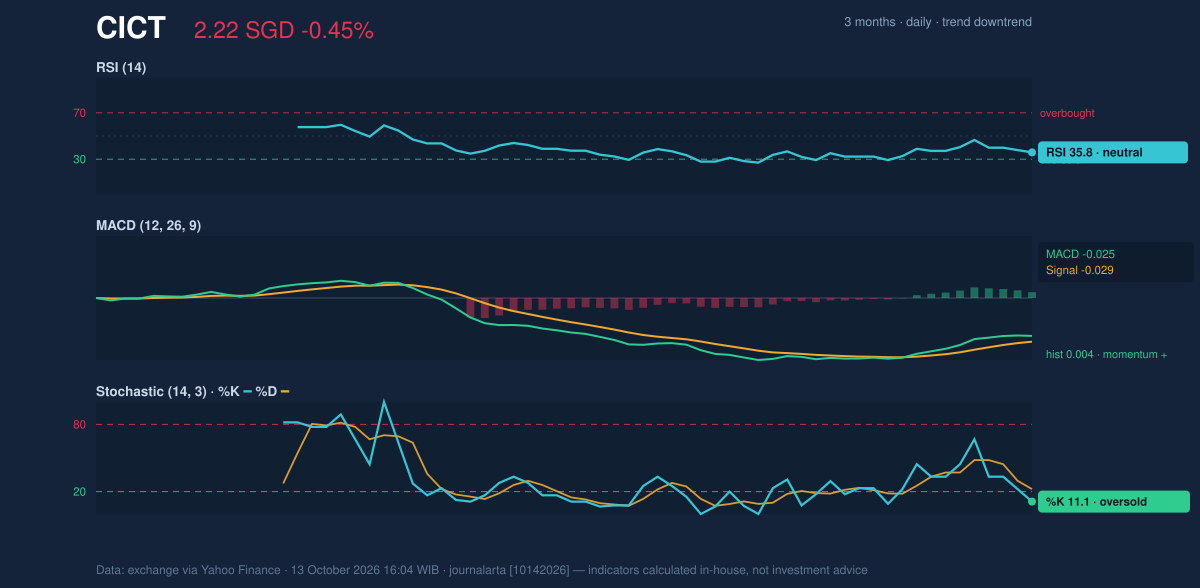
Volatility, Volume & Key Levels
Bollinger Bands are narrow: their 3.2% width is a squeeze, meaning recent price volatility has contracted and a larger move may follow, though the bands do not indicate its direction. The %B reading of 12% places the price close to the lower band. With ATR at 0.04 SGD, or 1.9% of the share price, current volatility is moderate rather than exceptionally high. Participation was subdued. Volume of 21,637,700 units was 0.6 times the 20-trading-day average of 36,216,406, classified as thin, while OBV was rising. On-balance volume tracks buying and selling pressure through volume; its rise is a counter-signal to the weak price trend, but light turnover means it offers limited confirmation. The gap between falling prices and rising OBV is worth watching, not enough to establish that buyers have regained control. A move back above 2.25 SGD would put the SMA20 and Bollinger middle band back in view; resistance at 2.29 SGD is the next stated ceiling. Failure to hold 2.22 SGD would expose the three-month low at 2.21 SGD. A close above resistance, especially with volume strengthening, would provide firmer evidence that momentum is changing.Technical Verdict: HOLD (wait & see)
The indicators support a wait-and-see reading: the price remains below declining short-term and medium-term averages, but oversold Stochastic and a positive MACD histogram hint at a possible near-term pause or rebound. The Bollinger squeeze adds the prospect of a larger move without resolving its direction. The verdict is invalidated if price falls below 2.21 SGD, the three-month low. - Ideal Entry Range: 2.21–2.25 SGD, around the lower band/support and SMA20; this is a technical reference range, not a guarantee of a rebound. - Exit Target (Target Price): 2.29 SGD, the stated 20-day resistance. - Stop Loss: Below 2.21 SGD, aligned with the three-month low and lower Bollinger Band. For non-traders, the signals are mixed: the decline still dominates, but a short-term recovery has not been ruled out. This is technical analysis, not an investment recommendation. | Indicator | Reading | |---|---:| | Last price | 2.22 SGD | | SMA20 / SMA50 | 2.25 / 2.33 SGD | | RSI(14) | 35.8 | | Stochastic %K / %D | 11.1 / 22.2 | | MACD / signal / histogram | -0.025 / -0.029 / 0.004 | | Bollinger Bands (upper / middle / lower) | 2.28 / 2.25 / 2.21 SGD | | ATR(14) | 0.04 SGD | | Support / resistance (20 trading days) | 2.22 / 2.29 SGD | | Three-month high / low | 2.53 / 2.21 SGD | | Volume / 20-day average | 21,637,700 / 36,216,406 |Summary Data CICT
| Last price | 2.22 SGD |
| Change 1 day / 5 days / 1 month | -0.45% / -1.33% / -2.20% |
| Trend / MA-cross | downtrend / none |
| SMA20 / SMA50 | 2.25 / 2.33 |
| RSI (14) / Stochastic %K | 35.8 / 11.1 |
| Bollinger %B / ATR | 12% / 0.04 |
| Support / Resistance 20 days | 2.22 / 2.29 |
| Data as of | 13 October 2026 16:04 WIB |
Disclaimer: This technical analysis is generated automatically from exchange data (via Yahoo Finance) and indicators calculated by JournalArta, for information and education only. The verdict and the entry, target and stop-loss levels are not investment advice or a solicitation to buy or sell any security. Investment decisions and their risks rest solely with the reader.
Track CICT share price daily: live levels, support/resistance and our full CICT analysis history.