ICBC Stock Gains 0.20%, Testing Key Resistance In Focus
On October 13, 2026: price 7.64 HKD, trend sideways, RSI 54.8, support 7.45, resistance 7.71. technical analysis of icbc stock. ICBC Stock Gains — full details…
Trend & Price Action
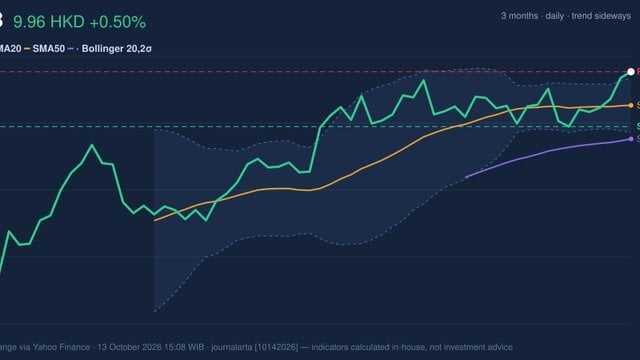
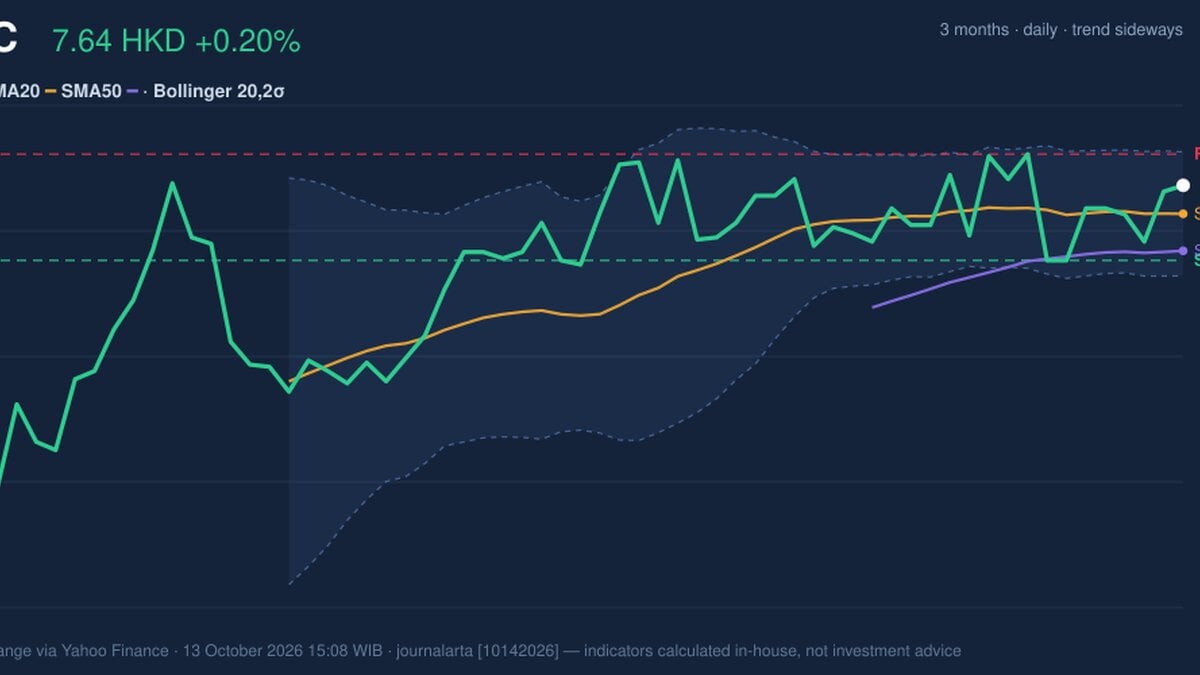
ICBC is moving sideways, with its 20-day simple moving average (SMA) slipping 0.02% over five trading days. The share price is above both the SMA20 at HK$7.57 and the SMA50 at HK$7.48, a constructive position that suggests recent trading has held above average levels. But there has been no new moving-average crossover, so the chart does not yet show a clear trend shift. The price is around 71% of the way through its recent trading range, closer to resistance than support. That placement can reflect persistent demand, but it also means the shares have less room to rise before meeting a known barrier. As shown in the chart, the upper Bollinger Band and 20-day resistance converge near HK$7.71, while the lower band is near the support area.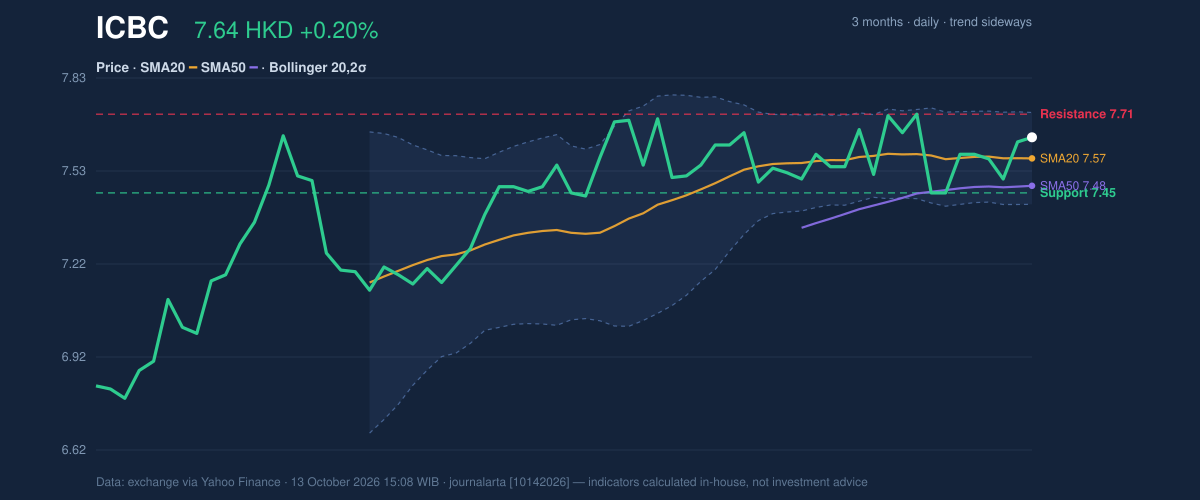
Oscillators & Momentum
The momentum readings are mixed rather than strongly bullish. The Relative Strength Index (RSI), which gauges the pace of recent gains and losses, is neutral at 54.8. The Stochastic oscillator, which compares the latest close with its recent price range, is also neutral, with %K at 63.0 and %D at 49.3. Neither signal indicates that the share price is at an extreme. The MACD offers a more cautious reading. Its value of 0.026 is below the signal line at 0.031, leaving a negative histogram of -0.005. That gap indicates near-term momentum is easing even though the stock remains above its moving averages. As shown in the chart, the momentum indicators therefore do not yet confirm that the approach to the three-month high is gathering strength.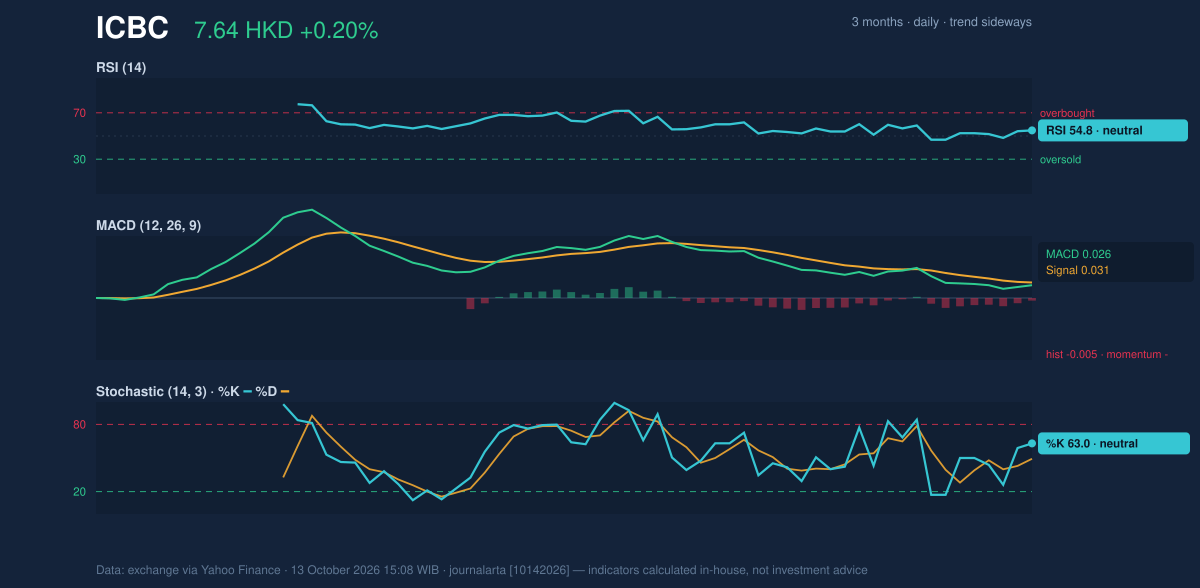
Volatility, Volume & Key Levels
Trading volume was 146.8 million shares, about 1.1 times the 20-day average. That above-average activity shows the latest move attracted more participation than usual, but falling On-Balance Volume (OBV)—a measure that accumulates volume on rising days and subtracts it on falling days—suggests buying pressure has not been consistently building. Volume supports attention to the price move, but OBV makes it harder to treat that move as confirmed accumulation. Average True Range (ATR), which measures typical price movement, is HK$0.16, or 2.1% of the share price. That points to moderate volatility. The three-month range runs from HK$6.65 to HK$7.77, putting the current price near its upper end. Resistance at HK$7.71–HK$7.72 is the immediate hurdle; support at HK$7.45, followed by the lower Bollinger Band at HK$7.42, is the key area to watch if the shares retreat.Technical Verdict: HOLD (wait & see)
HOLD (wait & see) is the clearest technical reading: the price remains above the SMA20 and SMA50, and RSI and Stochastic are neutral, but MACD momentum is negative and OBV is falling. The narrowing Bollinger Bands put added focus on whether price can clear resistance, rather than establishing that a breakout has begun. - Ideal entry range: HK$7.45–HK$7.57, spanning 20-day support and the SMA20. - Exit target: HK$7.71–HK$7.77, covering resistance and the three-month high. - Stop-loss protection: HK$7.42, at the lower Bollinger Band. - Invalidation: The verdict is invalidated if price falls below HK$7.42. In plain English, the chart is steady but undecided, with resistance and fading momentum still preventing a clear directional signal.Market data: exchange data via Yahoo Finance, as of October 13, 2026, 15:08 WIB.
Why ICBC is in focus today
- Trading near its 3-month high (7.77)
- Not covered by JournalArta in the last 14 days
Selected automatically from 16 HKEX (Hong Kong) stocks by a technical-signal score with daily weighted randomisation — not a recommendation.
Summary Data ICBC
| Last price | 7.64 HKD |
| Change 1 day / 5 days / 1 month | 0.20% / 0.73% / -0.20% |
| Trend / MA-cross | sideways / none |
| SMA20 / SMA50 | 7.57 / 7.48 |
| RSI (14) / Stochastic %K | 54.8 / 63.0 |
| Bollinger %B / ATR | 73% / 0.16 |
| Support / Resistance 20 days | 7.45 / 7.71 |
| Data as of | 13 October 2026 15:08 WIB |
Disclaimer: This technical analysis is generated automatically from exchange data (via Yahoo Finance) and indicators calculated by JournalArta, for information and education only. The verdict and the entry, target and stop-loss levels are not investment advice or a solicitation to buy or sell any security. Investment decisions and their risks rest solely with the reader.
Track ICBC share price daily: live levels, support/resistance and our full ICBC analysis history.