Genting Singapore Stock Technicals: Drops 0.81% on Monday, Testing Support Level
On October 12, 2026: price 0.61 SGD, trend sideways, RSI 40.0, support 0.61, resistance 0.63. technical analysis of genting singapore stock.
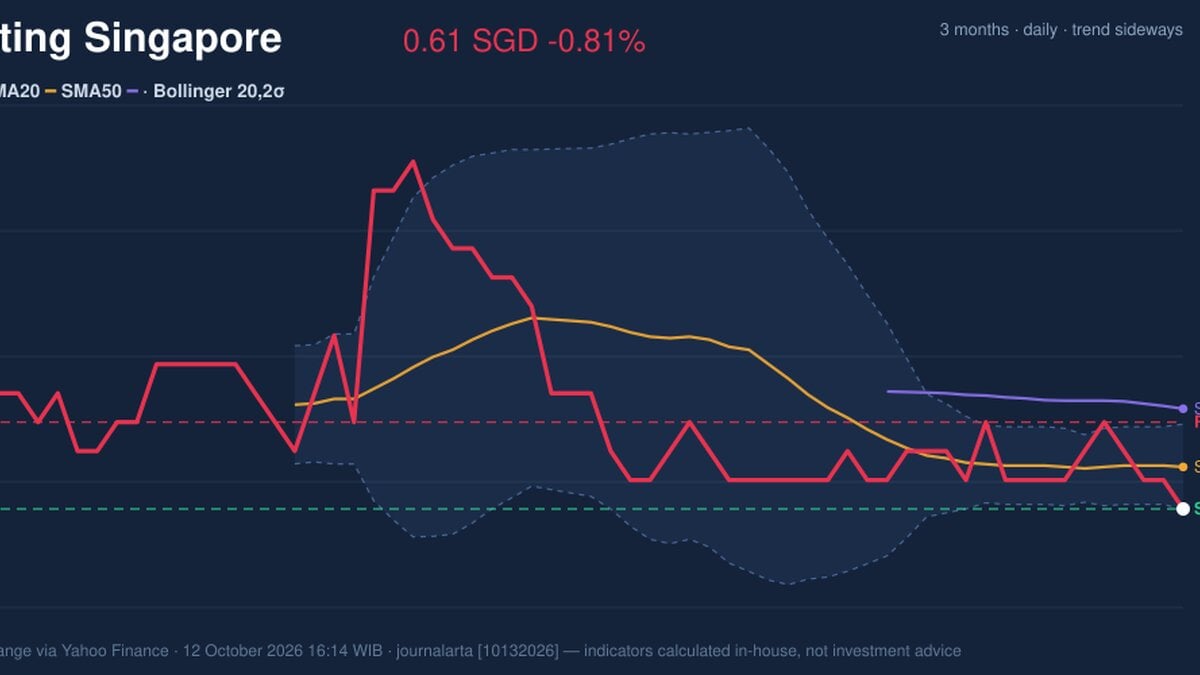
Why Genting Singapore is in focus today
- Closed at a 20-day low (0.61)
- Trading near its 3-month low (0.61)
Selected automatically from 16 SGX (Singapore) stocks by a technical-signal score with daily weighted randomisation — not a recommendation.
Trend & Price Action
The broader structure remains sideways, with the 20-day moving average nearly flat, rising just 0.04% over five days. Yet Genting Singapore’s S$0.61 close is below its S$0.62 20-day average and S$0.63 50-day average. The gap points to near-term weakness, although the data show no recent moving-average crossover to confirm a new sustained trend. The stock is also at the low end of its three-month range, which runs from S$0.61 to S$0.68. That position may attract attention to whether support holds, but proximity to a low does not by itself signal a rebound. The Bollinger Bands—a measure of how far price has been moving around its recent average—have narrowed to a 2.4% width. Such a squeeze reflects compressed volatility and can precede a larger move, but it does not indicate which direction that move will take. As shown in the chart, price is at the lower edge of the band, with the upper and middle lines at S$0.62 and the lower line at S$0.61.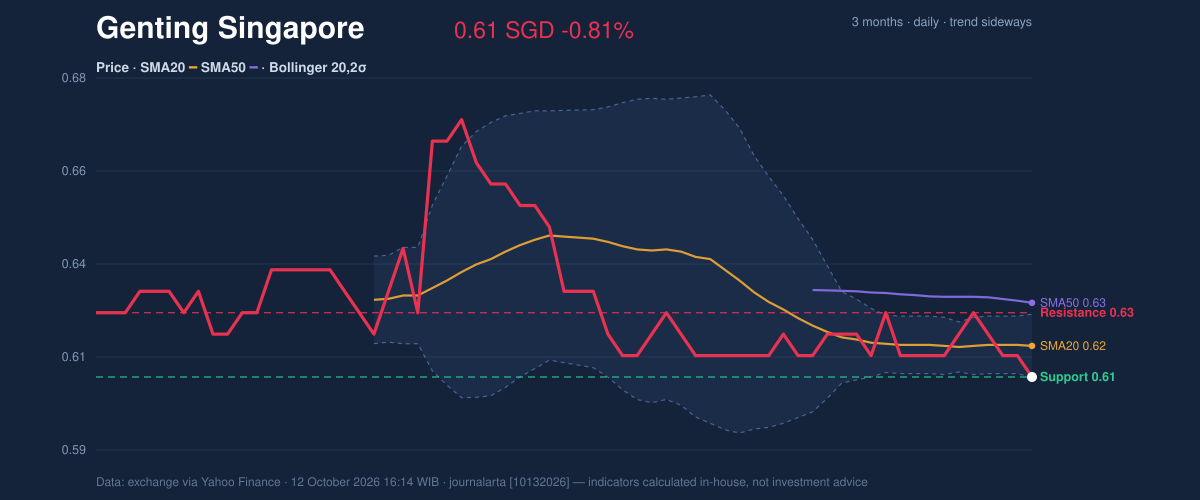
Oscillators & Momentum
Momentum readings are mixed rather than uniformly bearish. The Relative Strength Index (RSI), which gauges the pace of recent gains and losses, is 40.0, a neutral reading that does not point to an extreme condition. The Stochastic indicator is more stretched: %K is 0.0 against %D at 26.7, placing it in oversold territory. That can describe persistent short-term selling pressure; it is not, on its own, evidence that a reversal has begun. The Moving Average Convergence Divergence (MACD) is reported as negative at -0.003, with its signal also at -0.003 and a flat histogram at 0.000. The data label momentum positive, but the unchanged histogram offers little evidence of strengthening momentum. Read alongside the price below both moving averages, the indicators suggest a possible pause in downward pressure—not a confirmed change in trend. As shown in the chart, RSI, MACD and Stochastic provide different signals: neutral RSI, oversold Stochastic and a flat MACD histogram.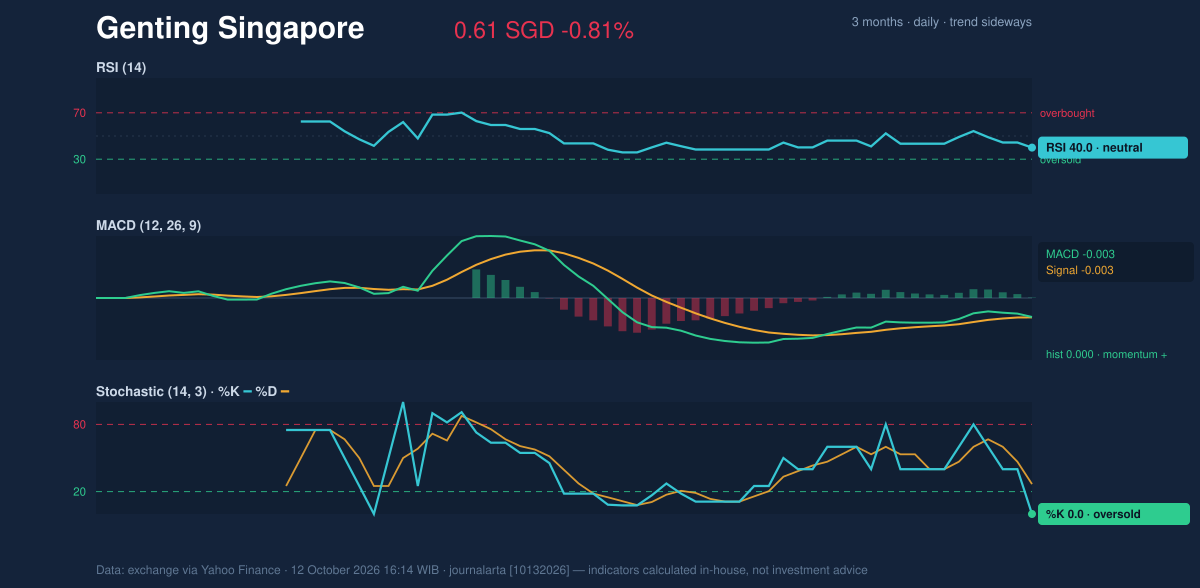
Volatility, Volume & Key Levels
Average True Range (ATR), a measure of typical price movement, is S$0.01, or 1.7% of the share price, indicating moderate volatility. In a tight trading range, that measure helps frame the scale of routine movement; the narrowing Bollinger Bands meanwhile suggest the market has become less volatile recently. The immediate technical test is S$0.61 support. A break below it would put the stock beneath its stated 20-day support and three-month low, weakening the case that the range is holding. On the upside, S$0.62—the 20-day average and Bollinger midpoint—is the first level to reclaim; S$0.63 resistance and the 50-day average form the next hurdle. Rising above those levels would improve the chart structure, but subdued volume and falling OBV, a running measure of volume flow, show that buying participation has not yet confirmed such a move. The central signal is a test of support under weak participation, with oversold Stochastic readings offering a possible—but unconfirmed—counterpoint.Technical Verdict: HOLD
HOLD (wait & see) fits the conflicting evidence: the price is below the SMA20 and SMA50, while Stochastic is oversold and MACD momentum is described as positive. Narrowing Bollinger Bands signal potential for a breakout, but neither direction is confirmed by the available volume data. - Ideal entry range: S$0.61–S$0.62, around stated support and the SMA20/Bollinger midpoint. - Exit target: S$0.63, the stated 20-day resistance and SMA50. - Stop-loss protection: Below S$0.61, the stated support and three-month low. - Invalidation condition: The verdict is invalidated if the price falls below S$0.61. For non-traders, the chart is at a decision point: support may hold, but the indicators do not yet confirm a recovery.Data
Market data: SGX via Yahoo Finance, as of 12 October 2026, 16:14 WIB. Last price S$0.61; previous close S$0.62. Daily change -0.81%; five-day change -1.61%; one-month change -0.81%. SMA20 S$0.62; SMA50 S$0.63. Bollinger Bands: upper and middle S$0.62, lower S$0.61; width 2.4%. RSI(14) 40.0; Stochastic %K 0.0, %D 26.7; MACD -0.003, signal -0.003, histogram 0.000. ATR(14) S$0.01. Volume 11,488,000; 20-day average 17,472,300. Support S$0.61; resistance S$0.63; three-month high/low S$0.68/S$0.61.Summary Data Genting Singapore
| Last price | 0.61 SGD |
| Change 1 day / 5 days / 1 month | -0.81% / -1.61% / -0.81% |
| Trend / MA-cross | sideways / none |
| SMA20 / SMA50 | 0.62 / 0.63 |
| RSI (14) / Stochastic %K | 40.0 / 0.0 |
| Bollinger %B / ATR | 1% / 0.01 |
| Support / Resistance 20 days | 0.61 / 0.63 |
| Data as of | 12 October 2026 16:14 WIB |
Disclaimer: This technical analysis is generated automatically from exchange data (via Yahoo Finance) and indicators calculated by JournalArta, for information and education only. The verdict and the entry, target and stop-loss levels are not investment advice or a solicitation to buy or sell any security. Investment decisions and their risks rest solely with the reader.
Track Genting Singapore share price daily: live levels, support/resistance and our full Genting Singapore analysis history.