CapitaLand Investment Stock Analysis: Drops 0.41%, RSI Oversold
On October 12, 2026: price 2.43 SGD, trend downtrend, RSI 28.8, support 2.43, resistance 2.65. technical analysis of capitaland investment stock.
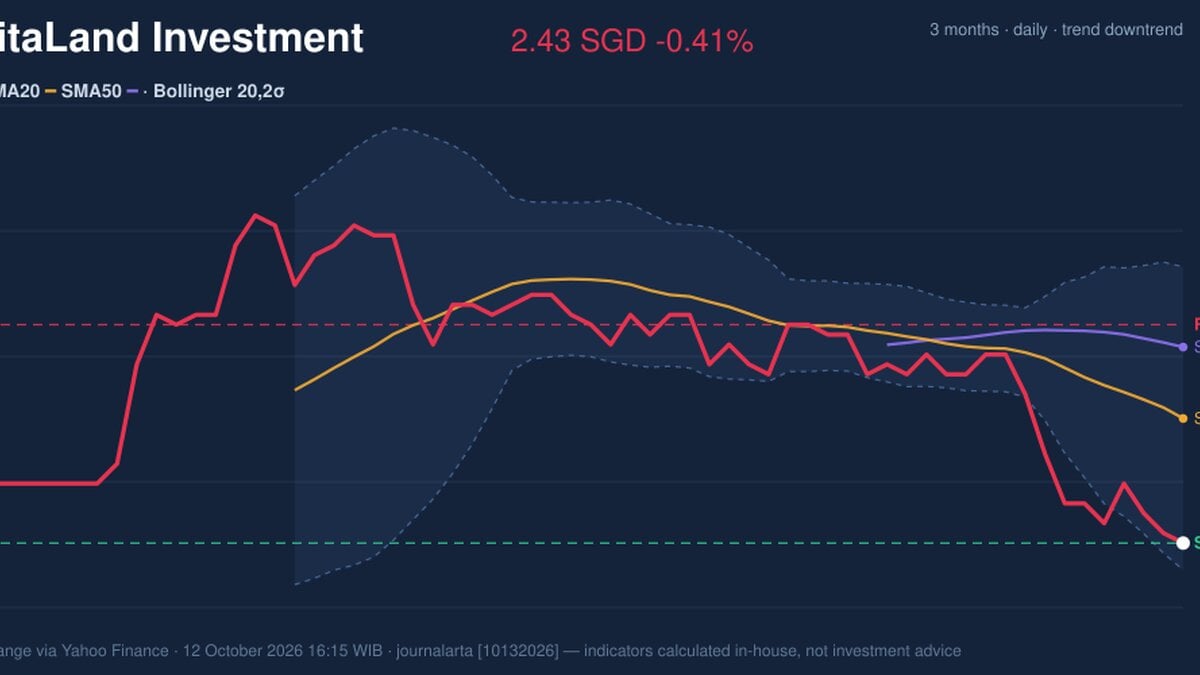
Why CapitaLand Investment is in focus today
- Closed at a 20-day low (2.43)
- Trading near its 3-month low (2.42)
- RSI(14) at 28.8 — oversold zone
- Downtrend extending (5-day change -1.62%)
- Not covered by JournalArta in the last 14 days
Selected automatically from 16 SGX (Singapore) stocks by a technical-signal score with daily weighted randomisation — not a recommendation.
Trend & Price Action
The last price is below the SMA20 at S$2.56 and the SMA50 at S$2.63. A moving average smooths price swings to show the prevailing direction; when the share price stays below both, rallies have yet to overturn the weakness. The SMA20’s 1.60% decline over five days reinforces that reading. There has been no new moving-average crossover, so there is no fresh signal of a trend change. CapitaLand Investment is at the floor of its 20-day range, with support at S$2.43, and only S$0.01 above its three-month low of S$2.42. That leaves little distance to the next observed low, but a support level is not a guarantee: a close below it would suggest the market is testing prices beyond the recent range. As shown in the chart, the price is also near the lower Bollinger Band, while both moving averages remain above it.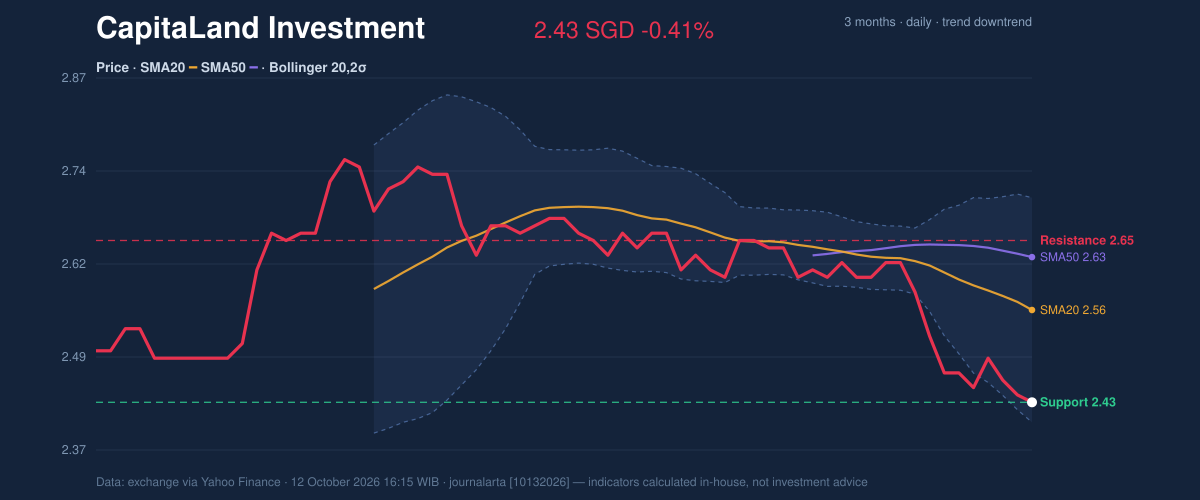
Oscillators & Momentum
The RSI is 28.8, below the commonly watched 30 threshold for oversold conditions. The Stochastic readings are also oversold, with %K at 4.2 and %D at 4.4. These measures indicate that recent selling has been pronounced. They can precede a bounce, but they can also stay depressed while a downtrend continues. The MACD remains negative: its value is -0.051, below the -0.037 signal line, with a negative histogram of -0.014. MACD compares short- and longer-term price momentum; its current configuration means selling momentum has not yet produced a technical confirmation of recovery. That divergence in the evidence matters: the oscillators show an extended decline, while MACD still points down. As shown in the chart, RSI and Stochastic are compressed near oversold territory, while MACD remains below its signal line.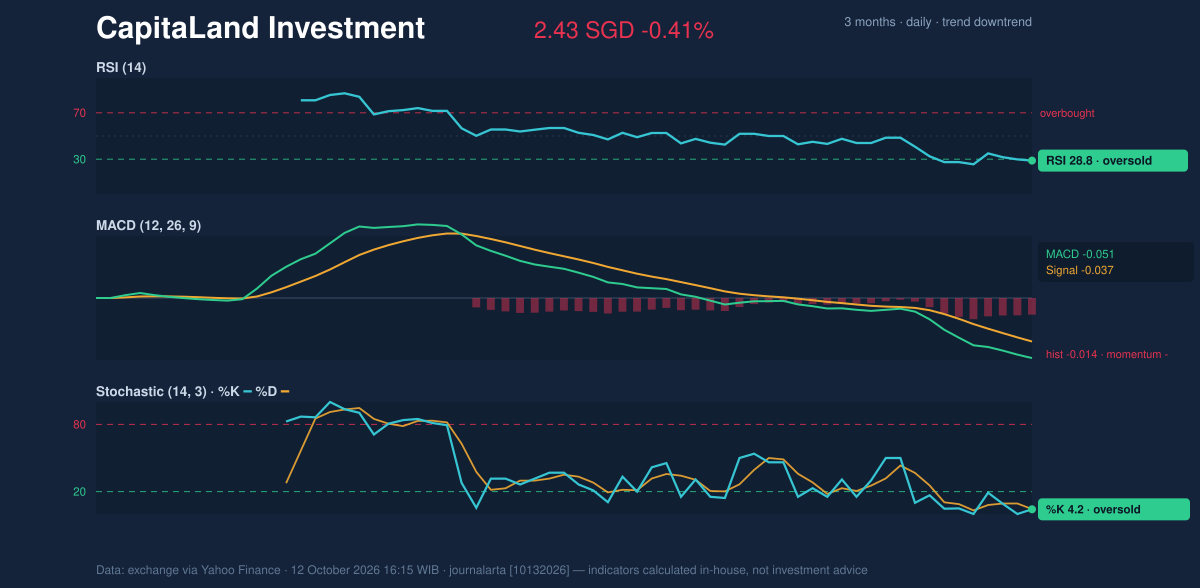
Volatility, Volume & Levels
Average true range, a measure of typical daily price movement, is S$0.05, or 2.2% of the share price—moderate volatility by the supplied data. Volume was 6.85 million shares, about 0.7 times its 20-day average of 10.23 million, while on-balance volume was falling. OBV tracks whether volume is flowing more heavily on rising or falling sessions; its decline adds to the evidence of weak participation rather than showing accumulation beneath the price drop. The immediate level to watch is S$2.43 support, with the three-month low at S$2.42 close beneath it. If price holds there and recovers, the SMA20 at S$2.56 is an initial reference point, followed by S$2.65 resistance. Failure to hold the nearby lows would weaken the case for a short-term floor.Technical Verdict: HOLD (wait & see)
The verdict is based on conflicting signals: RSI and Stochastic are oversold, but price remains below falling moving averages, MACD is negative, and OBV is declining. The core technical reading is weakness with a possible—but unconfirmed—oversold bounce. This view is invalidated if the price falls below S$2.42, the three-month low. - Ideal entry range: S$2.42–S$2.43, anchored to the three-month low and 20-day support. - Exit target: S$2.56, the SMA20; S$2.65 is the next resistance reference. - Stop-loss protection: Below S$2.42, the nearest stated lower level. For non-traders, the indicators say the shares are under pressure and oversold, but have not yet shown a reliable sign that the decline has turned.Summary Data CapitaLand Investment
| Last price | 2.43 SGD |
| Change 1 day / 5 days / 1 month | -0.41% / -1.62% / -8.30% |
| Trend / MA-cross | downtrend / none |
| SMA20 / SMA50 | 2.56 / 2.63 |
| RSI (14) / Stochastic %K | 28.8 / 4.2 |
| Bollinger %B / ATR | 9% / 0.05 |
| Support / Resistance 20 days | 2.43 / 2.65 |
| Data as of | 12 October 2026 16:15 WIB |
Disclaimer: This technical analysis is generated automatically from exchange data (via Yahoo Finance) and indicators calculated by JournalArta, for information and education only. The verdict and the entry, target and stop-loss levels are not investment advice or a solicitation to buy or sell any security. Investment decisions and their risks rest solely with the reader.
Track CapitaLand Investment share price daily: live levels, support/resistance and our full CapitaLand Investment analysis history.