JD.com Stock Gains 2.75% on Monday, Testing Key Resistance
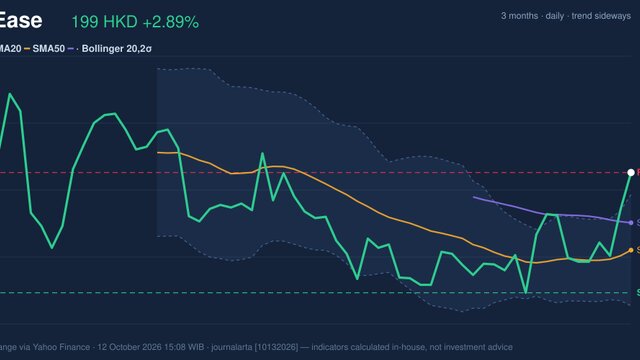
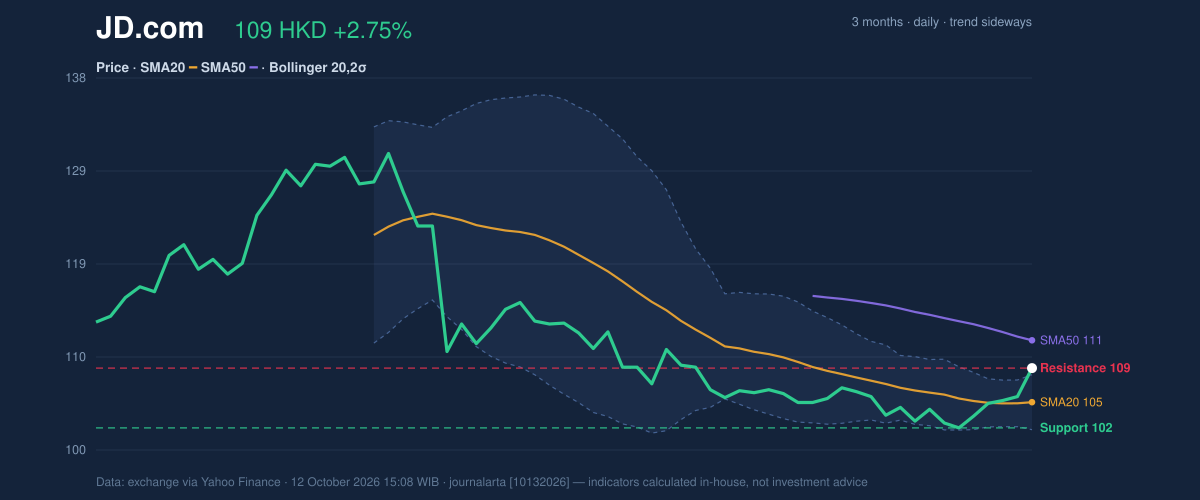
On October 12, 2026: price 108.50 HKD, trend sideways, RSI 56.4, support 102.40, resistance 108.50. technical analysis of jd.com stock.
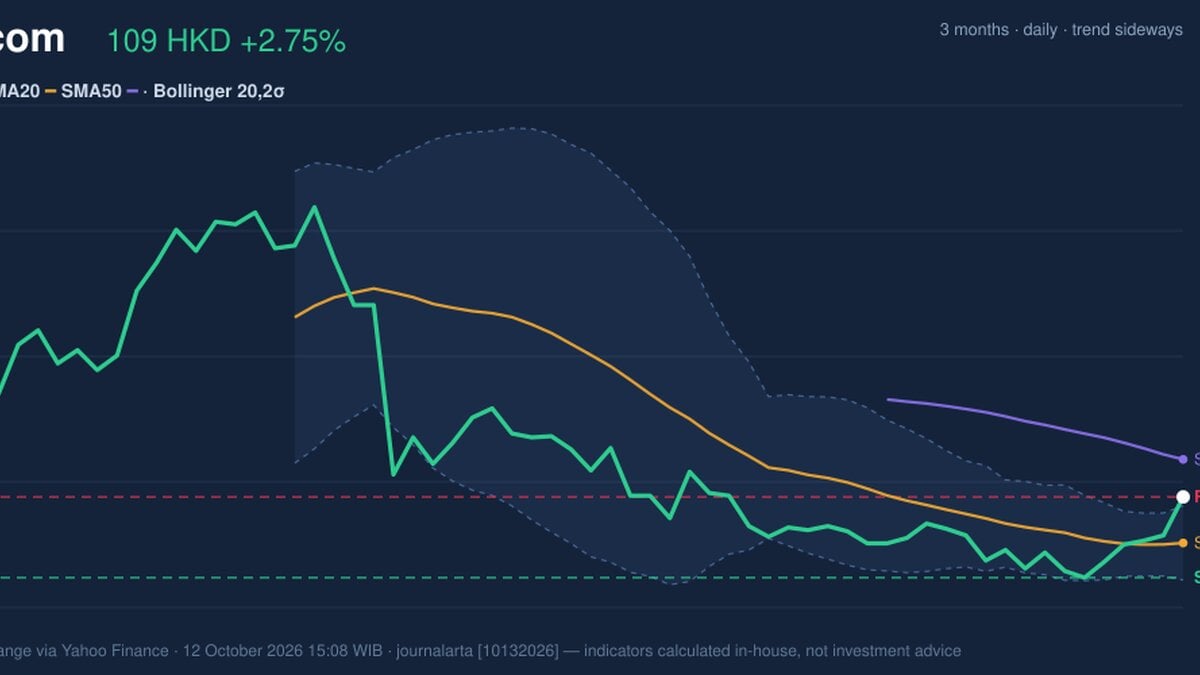
Trend & Price Action
Momentum & Participation
The RSI, a measure of recent gains against losses, stands at 56.4, in neutral territory. It supports the reading of improving but not broadly overheated momentum. The Stochastic oscillator, which compares the latest close with its recent trading range, is more cautionary: %K at 95.3 and %D at 78.7 signal overbought conditions. That can reflect strong buying pressure, while also raising the risk of a pause or pullback. MACD offers a constructive counterpoint. Its reading is -1.225, above the signal line at -1.979, with a positive histogram of 0.754. MACD remains below zero, so the longer momentum backdrop has not fully turned positive, but the gap between the indicator and its signal line shows that downside momentum has eased and near-term momentum is improving.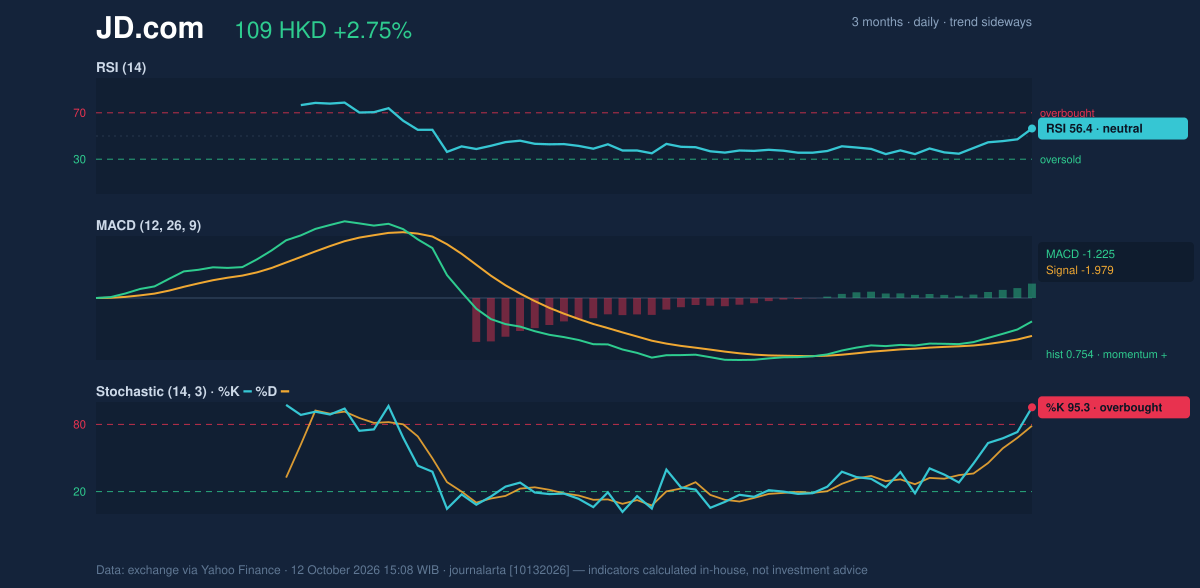
Key Levels & Scenarios
The immediate levels are HK$108.50 resistance and HK$102.40 support, the recent 20-day boundaries. A sustained move above resistance would make the Bollinger-band breakout more credible, particularly if volume and OBV remain firm. Failure to hold above the breakout area, by contrast, could leave the move vulnerable to a return toward the SMA20 at HK$105.03. Below that, the marked support at HK$102.40 is the more consequential near-term test. The narrowing Bollinger Bands (5.3%) imply that a period of low volatility has preceded the current expansion, but they do not determine its direction. The average true range of HK$2.29, equivalent to 2.1% of the share price, indicates moderate day-to-day volatility. The overbought Stochastic reading makes a brief consolidation plausible even if the broader breakout attempt remains intact.Technical Verdict: HOLD (wait & see)
HOLD (wait & see) fits the mixed technical picture. Price is above the SMA20, MACD momentum is improving, and the 1.9-times volume surge with rising OBV confirms meaningful participation. Against that, the share remains below the SMA50, the wider trend is sideways, and the Stochastic is overbought. The verdict is invalidated if price falls below HK$102.40.- Ideal entry range: HK$105.03–HK$108.50, spanning the SMA20 to the tested resistance.
- Exit target: HK$111.34, the SMA50 resistance level.
- Stop-loss protection: HK$102.22, the lower Bollinger Band.
As of 15:08 WIB on Oct. 12, 2026, JD.com’s Hong Kong shares traded at HK$108.50.
Why JD.com is in focus today
- One-day move of 2.75%, about 1.3× its average daily range (ATR)
- Volume at 1.9× the 20-day average
- Closed at a 20-day high (108.50)
- Breaking out of a Bollinger squeeze (band width 5.3%)
- Not covered by JournalArta in the last 14 days
Selected automatically from 16 HKEX (Hong Kong) stocks by a technical-signal score with daily weighted randomisation — not a recommendation.
Summary Data JD.com
| Last price | 108.50 HKD |
| Change 1 day / 5 days / 1 month | 2.75% / 5.96% / 2.17% |
| Trend / MA-cross | sideways / none |
| SMA20 / SMA50 | 105.03 / 111.34 |
| RSI (14) / Stochastic %K | 56.4 / 95.3 |
| Bollinger %B / ATR | 112% / 2.29 |
| Support / Resistance 20 days | 102.40 / 108.50 |
| Data as of | 12 October 2026 15:08 WIB |
Disclaimer: This technical analysis is generated automatically from exchange data (via Yahoo Finance) and indicators calculated by JournalArta, for information and education only. The verdict and the entry, target and stop-loss levels are not investment advice or a solicitation to buy or sell any security. Investment decisions and their risks rest solely with the reader.
Track JD.com share price daily: live levels, support/resistance and our full JD.com analysis history.