NetEase Stock Gains 2.89%, Testing Key Resistance In Focus
On October 12, 2026: price 199.10 HKD, trend sideways, RSI 62.3, support 180.90, resistance 199.10. technical analysis of netease stock.
Trend & Price Action
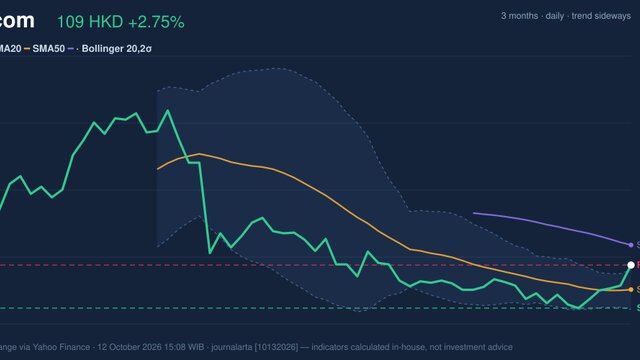
At HK$199.10, NetEase is above its SMA20 of HK$187.36 and SMA50 of HK$191.49. The SMA20 has risen 0.78% over five days, indicating a modestly improving short-term trend. Still, the absence of a fresh crossover means the averages have not delivered a stronger confirmation that the direction has changed. The price is now at the top of its 20-day range, with support at HK$180.90 and resistance at HK$199.10. It is also approaching the three-month high of HK$213.00, although a nearby ceiling matters more immediately: traders will be watching whether the latest close can hold above the 20-day resistance or whether gains stall at that level. The close at HK$199.10 puts NetEase at a technical decision point, not yet beyond resistance. As shown in the chart, the share price has moved above its short-term averages and beyond the upper Bollinger band, while the marked resistance sits at the current close.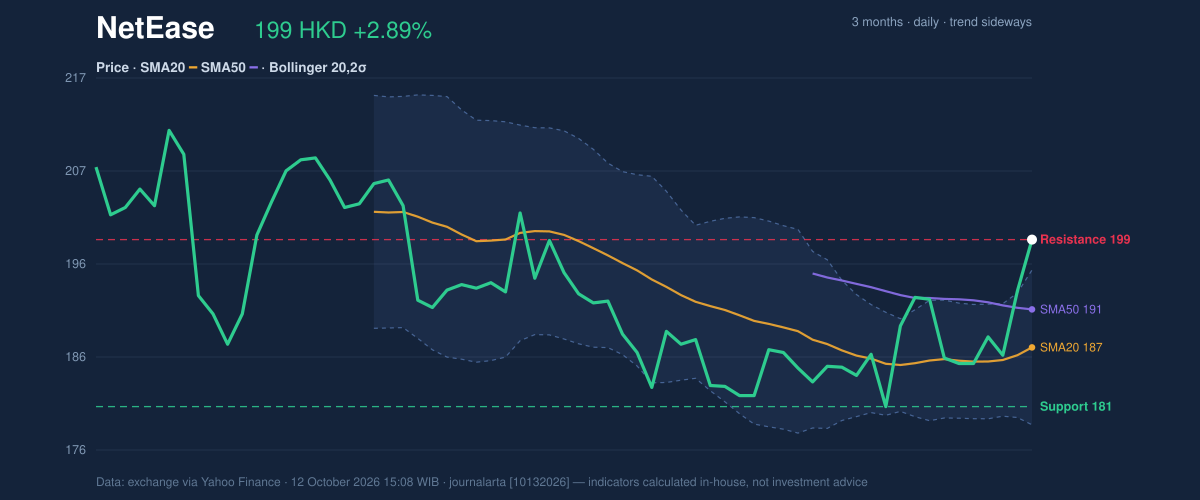
Oscillators & Momentum
Momentum indicators are positive but not uniformly comfortable. The RSI, a measure of recent price strength, is 62.3 and remains in neutral territory. The MACD is also positive: its reading is 0.594, above the signal line at -0.838, with a positive histogram of 1.432. Together, those readings suggest upward momentum is intact. The Stochastic indicator, which compares the latest close with the recent trading range, presents a caution. Its %K is 90.5 and %D is 78.3, both signaling overbought conditions. That does not guarantee a reversal, but it indicates the price has risen quickly enough that a pause or pullback would be consistent with the current setup. RSI remains neutral, MACD momentum is positive, and Stochastic is overbought. The split matters: the broader momentum readings support the rally, while the Stochastic warns that its pace may be difficult to sustain without a consolidation. The chart places these signals alongside the recent price move, helping distinguish persistent momentum from a potentially stretched short-term advance.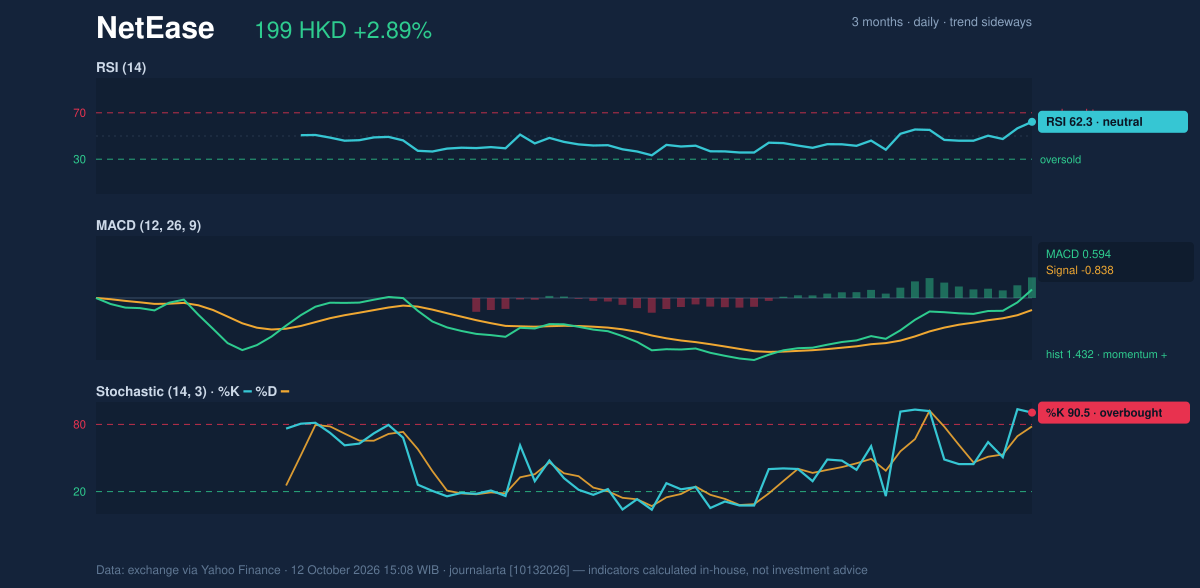
Volatility, Volume & Key Levels
NetEase’s close is above the upper Bollinger band at HK$195.79; the band indicator’s %B reading is 120%. Bollinger bands track price relative to a recent average and its typical variation, so a reading above the upper band shows the price has moved beyond its usual range. The band width is 9.0%, described as normal rather than unusually compressed or expanded. Volume adds support to the advance. The latest session recorded 8,420,174 shares, compared with a 20-day average of 5,417,226, and the on-balance volume indicator is rising. Higher volume alongside a price increase suggests broader participation, rather than a move occurring on thin trading. The ATR is HK$5.54, or 2.8% of the share price, pointing to moderate daily price variability. The immediate test is HK$199.10. A sustained move above that resistance would put the three-month high of HK$213.00 in view; failure to hold the breakout area could bring the SMA50 at HK$191.49, then the SMA20 at HK$187.36, into focus. The stated 20-day support is lower, at HK$180.90.Technical Verdict: HOLD (wait & see)
The technical picture supports a wait-and-see stance. The price is above both moving averages, MACD momentum is positive, and rising volume with higher OBV confirms stronger participation. Against that, the share is at 20-day resistance, above the upper Bollinger band, and Stochastic readings are overbought. The verdict is invalidated if the price falls below HK$180.90, the 20-day support level.- Ideal entry range: HK$191.49–HK$199.10, using the SMA50 and current resistance as reference levels.
- Exit target: HK$213.00, the three-month high.
- Stop-loss protection: HK$180.90, the stated 20-day support.
Data table
Why NetEase is in focus today
- Volume at 1.6× the 20-day average
- Closed at a 20-day high (199.10)
- Not covered by JournalArta in the last 14 days
Selected automatically from 16 HKEX (Hong Kong) stocks by a technical-signal score with daily weighted randomisation — not a recommendation.
| Last price | HK$199.10 |
| Daily change | +2.89% |
| SMA20 / SMA50 | HK$187.36 / HK$191.49 |
| RSI / Stochastic | 62.3 / 90.5 (%K), 78.3 (%D) |
| MACD / signal / histogram | 0.594 / -0.838 / 1.432 |
| Support / resistance | HK$180.90 / HK$199.10 |
| Three-month high / low | HK$213.00 / HK$179.00 |
| Volume / 20-day average | 8,420,174 / 5,417,226 |
Summary Data NetEase
| Last price | 199.10 HKD |
| Change 1 day / 5 days / 1 month | 2.89% / 7.27% / 9.34% |
| Trend / MA-cross | sideways / none |
| SMA20 / SMA50 | 187.36 / 191.49 |
| RSI (14) / Stochastic %K | 62.3 / 90.5 |
| Bollinger %B / ATR | 120% / 5.54 |
| Support / Resistance 20 days | 180.90 / 199.10 |
| Data as of | 12 October 2026 15:08 WIB |
Disclaimer: This technical analysis is generated automatically from exchange data (via Yahoo Finance) and indicators calculated by JournalArta, for information and education only. The verdict and the entry, target and stop-loss levels are not investment advice or a solicitation to buy or sell any security. Investment decisions and their risks rest solely with the reader.
Track NetEase share price daily: live levels, support/resistance and our full NetEase analysis history.