Testing Support Level, OCBC Stock Gains 0.21% on Monday
On October 12, 2026: price 29.06 SGD, trend sideways, RSI 31.4, support 29.00, resistance 32.22. technical analysis of ocbc stock. Testing Support Level — full…
By Alistair Sterling
October 12, 20263 min read
Testing Support Level, OCBC Stock Gains 0.21% on Monday
OCBC closed at S$29.06 on 12 October, up 0.21% on the day but down 8.85% over five trading days, according to exchange data via Yahoo Finance. The small daily gain came with price near the bottom of its 20-day range and below both key moving averages: a short-term bounce has yet to change the broader weak technical picture.
Trend & Price Action
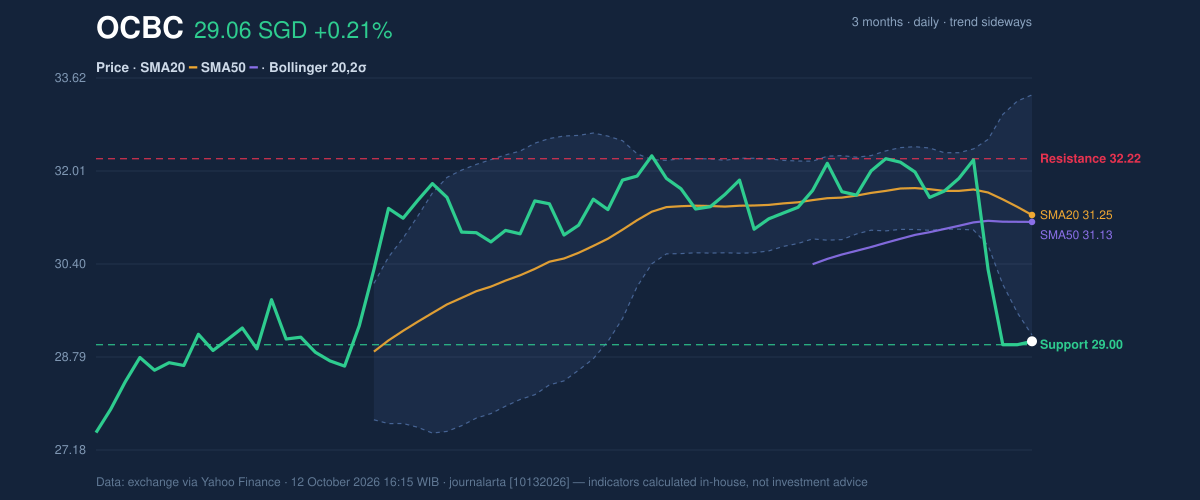
The share price sits below the 20-day simple moving average (SMA20) at S$31.25 and the 50-day average (SMA50) at S$31.13. The SMA20 is falling, down 1.32% over five days, while no recent crossover between the averages is recorded. That combination points to fading short-term momentum, not a confirmed trend reversal.
Price is just above the 20-day support at S$29.00, and only 2% above the bottom of the recent trading range. The lower Bollinger Band, a measure of how far price has moved from its recent average, is S$29.17; the reading below that band signals unusually weak positioning relative to the recent price pattern. The bands are not especially narrow, however, so this is not a classic volatility squeeze that would suggest a large move is being coiled.
The technical picture is pressured, with price testing support rather than establishing a base. The three-month range, from S$27.17 to S$32.57, puts current trading closer to the low than the high.
3-month price action chart of OCBC: price, SMA20/50, Bollinger, support & resistance. Data: exchange via Yahoo Finance.
Oscillators & Momentum
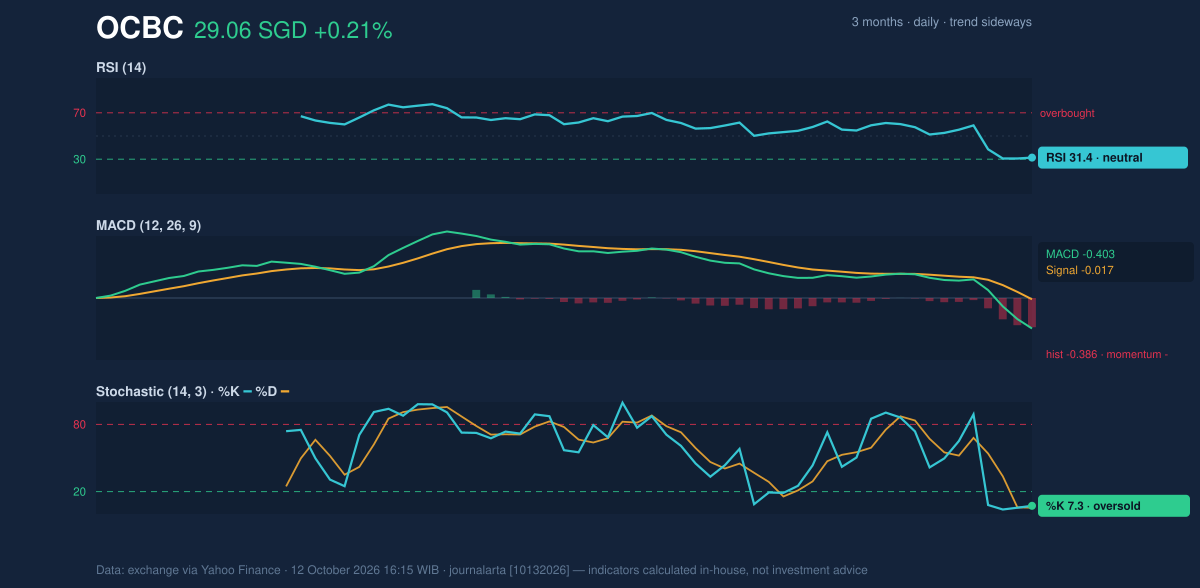
Momentum indicators reinforce the price weakness, though they also show that selling has become stretched. The RSI, which measures the pace of recent gains and losses, is at 31.4, a neutral reading close to oversold territory. Stochastic %K at 7.3 and %D at 5.7 are oversold, indicating that price has fallen sharply relative to its recent range. These readings can accompany a rebound, but they do not by themselves confirm one.
The MACD is more clearly negative: at -0.403 against a signal line of -0.017, with a -0.386 histogram. Negative MACD momentum suggests sellers still have the stronger near-term hand. In other words, oversold conditions describe how far the decline has gone; the MACD indicates that downward pressure has not yet visibly turned.
Momentum chart of OCBC: RSI(14), MACD, Stochastic. Data: exchange via Yahoo Finance.
Volatility, Volume & Key Levels
The average true range (ATR), a gauge of typical price movement, stands at S$0.66, or 2.3% of the share price, pointing to moderate volatility. Volume was 9.15 million shares, close to its 20-day average of 8.78 million. Trading participation was therefore broadly normal rather than an exceptional surge, while falling on-balance volume (OBV) suggests accumulated buying interest has weakened.
The immediate test is S$29.00 support. A sustained break below it would expose the stock to renewed pressure toward the three-month low of S$27.17. If support holds, the first meaningful recovery hurdle is the 20-day resistance at S$32.22, near both moving averages. A move back above that area would improve the chart’s structure, but the current indicators do not yet show that confirmation.
Technical Verdict: HOLD (wait & see)
The verdict reflects three signals: price remains below both the SMA20 and SMA50; MACD momentum is negative; and Stochastic is oversold, leaving room for a rebound but not proving that one has begun. The assessment is invalidated if price falls below S$29.00 support.
Indicative entry range: S$29.00–S$29.17, around 20-day support and the lower Bollinger Band.
Indicative exit target: S$32.22, the 20-day resistance level.
For non-traders, HOLD means the chart is weak but close to support, so its next move needs confirmation.
Summary Data OCBC
Last price
29.06 SGD
Change 1 day / 5 days / 1 month
0.21% / -8.85% / -8.76%
Trend / MA-cross
sideways / none
SMA20 / SMA50
31.25 / 31.13
RSI (14) / Stochastic %K
31.4 / 7.3
Bollinger %B / ATR
-3% / 0.66
Support / Resistance 20 days
29.00 / 32.22
Data as of
12 October 2026 16:15 WIB
Disclaimer: This technical analysis is generated automatically from exchange data (via Yahoo Finance) and indicators calculated by JournalArta, for information and education only. The verdict and the entry, target and stop-loss levels are not investment advice or a solicitation to buy or sell any security. Investment decisions and their risks rest solely with the reader.