Shell Stock Analysis: Gains 3.63%, RSI Overbought
On October 8, 2026: price 3,780.50 GBp, trend uptrend, RSI 71.5, support 3,488.50, resistance 3,780.50. technical analysis of shell stock.
Trend & Price Action
Shell’s shares have gained 5.34% over five trading days and 7.01% over one month. The price is above both the 20-day simple moving average, or SMA, at 3,600.85 GBp, and the 50-day SMA at 3,469.31 GBp. A simple moving average smooths recent prices to show the underlying direction; here, the gap between the two averages and a 1.20% five-day rise in the 20-day average point to an established upward trend, rather than a single-day jump. There is no new moving-average crossover, so the trend signal comes from price holding above both averages, not a fresh technical trigger. The share price has also reached the listed 20-day resistance and three-month high of 3,780.50 GBp. That marks a meaningful test: a move beyond the range could extend the breakout, while a failure to hold near its upper edge would expose the distance between price and the short-term average. As shown in the chart, the price has moved above the upper Bollinger Band at 3,724.03 GBp. Bollinger Bands measure how far a price sits from its recent average; a reading above the upper band can signal strong momentum, but also that the share price has stretched quickly. The band width is 6.8% and described as narrowing, a squeeze that can precede a larger move. Because price is already above the band, the expansion is occurring alongside a breakout attempt rather than from a quiet, central position.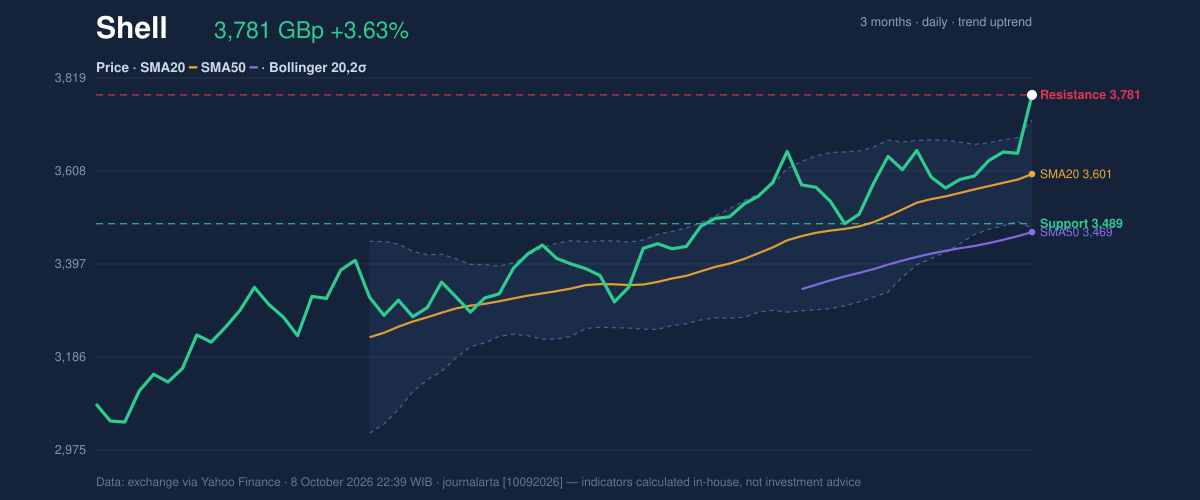
Oscillators & Momentum
The momentum indicators confirm the advance, but they also warn that it may be difficult to sustain at the same pace. The RSI is 71.5, in overbought territory, while the Stochastic is also overbought, with %K at 100.0 and %D at 89.0. These measures compare recent gains and losses; high readings indicate strong buying pressure, not an automatic reversal, but leave less room for further gains before the move looks increasingly extended. The MACD offers the clearest sign that momentum has improved. Its reading of 62.079 is above the 55.579 signal line, and its histogram has turned positive at 6.501. A positive histogram means the MACD line is strengthening relative to its signal line, supporting the upward trend rather than contradicting it. The signal is constructive, though not enough by itself to remove the overbought warning. As shown in the chart, the MACD turn is aligned with the rising price, while RSI and Stochastic register the speed of the move. That combination often means trend and timing are telling different stories: direction is positive, but the entry point is less forgiving after a rapid run.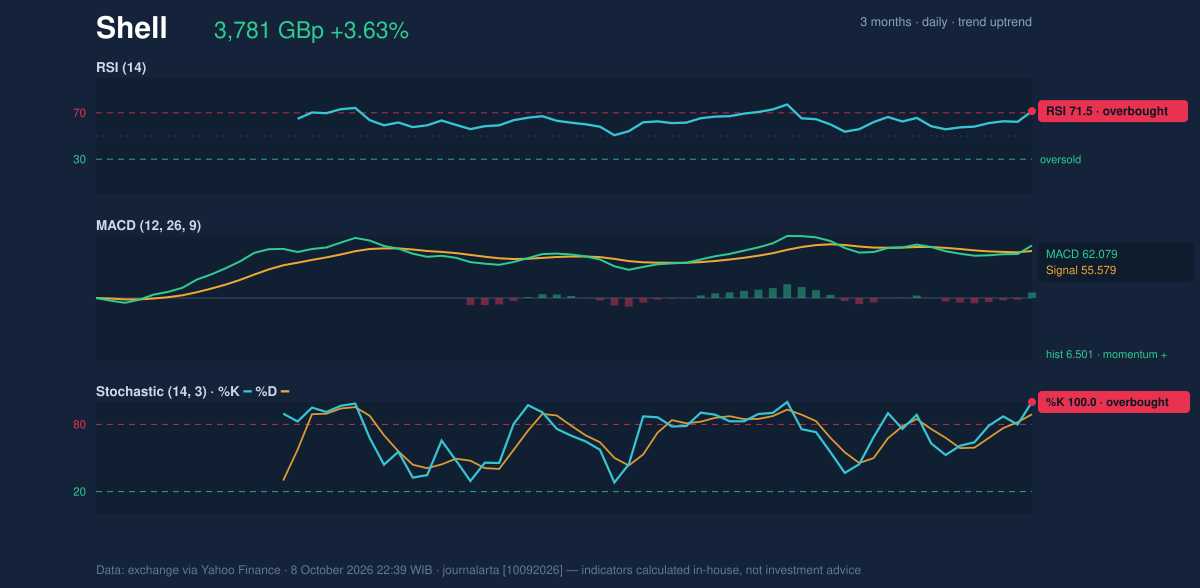
Volatility, Volume & Key Levels
The breakout lacks strong volume confirmation. Latest volume was 8,146 against a 20-day average of 10,235,994, reported as 0.0 times average and classified as thin. OBV, a running measure of whether volume is flowing with price, is rising, which is supportive; however, the unusually low reported turnover makes that confirmation less convincing. The data therefore show an advancing price, but not broad participation in the latest session. Volatility is also elevated: the 14-day ATR is 332.96 GBp, equal to 8.8% of the share price. ATR estimates the typical size of price movement, not its direction. In practical terms, a move of this scale can make near-term swings substantial, so the overbought readings matter more when price is already near a recorded high. The main levels are 3,780.50 GBp resistance and 3,488.50 GBp support. If price clears resistance and holds above it, the move would extend beyond the listed range; if it falls below support, the short-term breakout case would be weakened. The 20-day average at 3,600.85 GBp is an intermediate reference between those levels, while the lower Bollinger Band at 3,477.67 GBp sits close to support.Technical Verdict: HOLD
The technical reading is HOLD (wait & see): the rising averages and positive MACD support the trend, but overbought RSI and Stochastic readings, thin volume and an elevated ATR argue for caution near resistance. The verdict is invalidated if price falls below 3,488.50 GBp support.- Ideal entry range: 3,600.85–3,724.03 GBp, using the 20-day average and upper Bollinger Band as reference levels.
- Exit target: 3,780.50 GBp, the stated 20-day resistance and three-month high.
- Stop-loss protection: 3,477.67 GBp, at the lower Bollinger Band and just below the listed support.
Market data: London Stock Exchange figures via Yahoo Finance, as of 8 October 2026, 22:39 WIB.
Why Shell is in focus today
- Closed at a 20-day high (3,780.50)
- Trading near its 3-month high (3,780.50)
- RSI(14) at 71.5 — overbought zone
- MACD histogram has just turned positive
- Breaking out of a Bollinger squeeze (band width 6.8%)
- Uptrend confirmed (5-day change 5.34%)
Selected automatically from 16 LSE (UK) stocks by a technical-signal score with daily weighted randomisation — not a recommendation.
Summary Data Shell
| Last price | 3,780.50 GBp |
| Change 1 day / 5 days / 1 month | 3.63% / 5.34% / 7.01% |
| Trend / MA-cross | uptrend / none |
| SMA20 / SMA50 | 3,600.85 / 3,469.31 |
| RSI (14) / Stochastic %K | 71.5 / 100.0 |
| Bollinger %B / ATR | 123% / 332.96 |
| Support / Resistance 20 days | 3,488.50 / 3,780.50 |
| Data as of | 8 October 2026 22:39 WIB |
Disclaimer: This technical analysis is generated automatically from exchange data (via Yahoo Finance) and indicators calculated by JournalArta, for information and education only. The verdict and the entry, target and stop-loss levels are not investment advice or a solicitation to buy or sell any security. Investment decisions and their risks rest solely with the reader.
Track Shell share price daily: live levels, support/resistance and our full Shell analysis history.