Shell Stock Analysis: Drops 0.90%, Momentum Gains
On September 21, 2026: price 3,539.00 GBp, trend uptrend, RSI 59.7, support 3,311.00, resistance 3,652.50. technical analysis of shell stock.

Shell plc edged lower on the London Stock Exchange on Thursday, with the shares last changing hands at 3,539.00 GBp, down from 3,571.00 the previous close, even as the broader chart still points to an established uptrend. The move matters less as a one-day dip than as a test of whether recent gains have enough follow-through to keep the stock pressing toward the upper end of its range, where supply has already started to appear.
Trend & Price Action
The price remains above both the SMA20 at 3,472.78 and the SMA50 at 3,359.82, which is the clearest sign that the medium-term structure is still constructive. In plain terms, the shares are trading above the average prices of the past month and roughly two months, so the market is still treating pullbacks as pauses rather than breakdowns.
That said, the stock is no longer breaking away from the pack. It sits around the middle-upper part of its recent trading band, at roughly 67% of the 20-hour range, while the 20-hour resistance at 3,652.50 is close to the 3-month high of 3,663.50. As shown in the chart, that proximity to the top of the range means the next leg higher would likely need fresh buying rather than just momentum carryover.
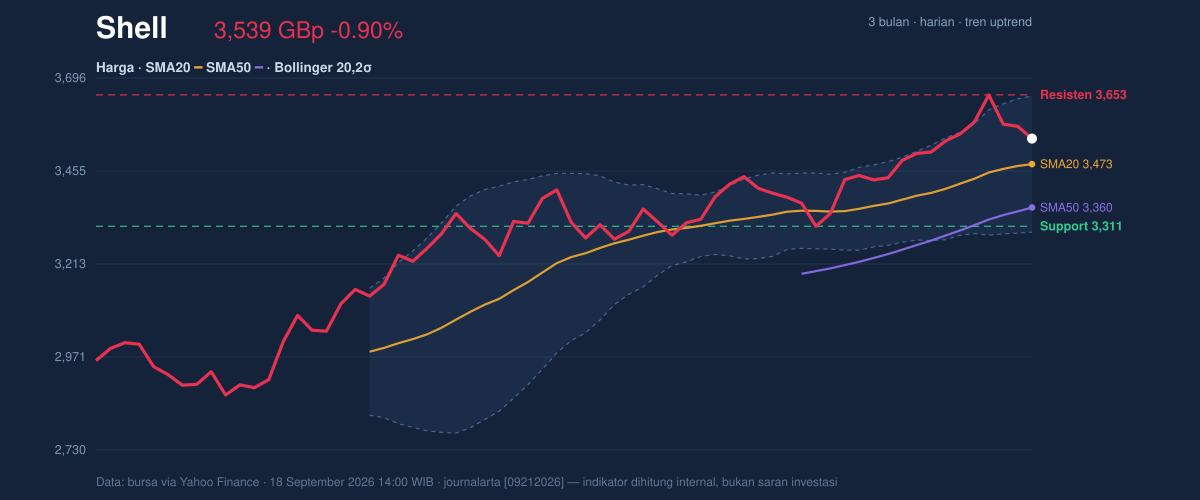
The lack of a new MA-cross is also telling. A moving-average cross is often used to mark a change in trend, but here the message is simpler: the trend is already positive, and the market is waiting for confirmation that it can extend, not merely hold.
Oscillators & Momentum
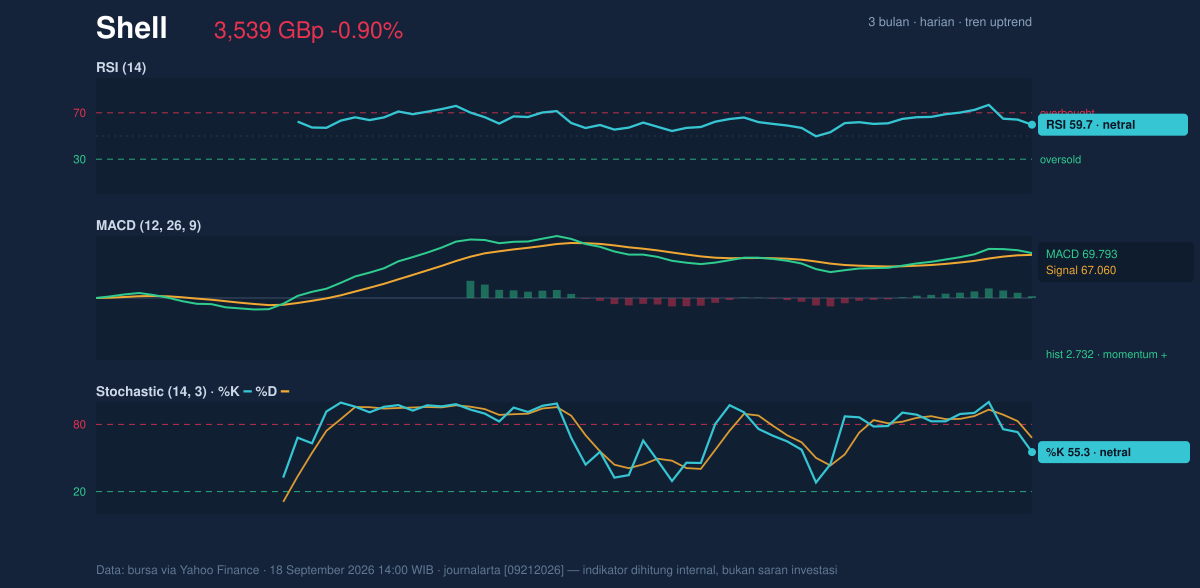
The oscillator picture is balanced rather than stretched. RSI at 59.7 is neutral, which suggests the stock is not overbought and still has room to advance if buyers reappear. Stochastic %K at 55.3 and %D at 68.1 are also neutral, but the gap between the two lines shows short-term momentum has cooled from a stronger reading. That does not signal weakness on its own; it simply says the pace of the advance has slowed.
The more important signal is the MACD at 69.793 above its signal line at 67.060, with a positive histogram of 2.732. MACD measures whether recent price action is gaining or losing strength, and here it still leans positive. Put differently, the trend is intact, but the market is not accelerating aggressively. That combination often leads to consolidation near resistance before either a breakout or a fade.
Volatility & Volume
Bollinger Bands add an important layer to the setup. The shares are trading inside the band, with %B at 69% and the upper band at 3,649.56. Since the band width is 10.2%, volatility is normal rather than compressed or explosive. That matters because a squeeze would usually hint at an imminent sharp move; this chart instead suggests a more orderly market that can still drift higher, but without the pressure that often forces a quick breakout.
The volume profile is more encouraging. Last turnover of 23,628,589 was about 2.1× the 20-hour average of 11,300,403, and OBV is rising. OBV, or on-balance volume, tracks whether trading volume is accumulating on up moves or down moves. A rising OBV alongside above-average volume usually means the latest price action has real participation behind it, not just a thin move caused by a few trades.
This is the strongest argument in the chart: the stock is not merely drifting above its averages; it is doing so with active participation, even if the momentum readings are not yet extreme.
Key Levels & Scenarios
The nearest floor is 3,311.00, the 20-hour support. That level matters because it sits below the current price but still well above the 20-hour average, so a drop toward it would represent a meaningful loss of short-term traction without fully damaging the larger trend.
Above current levels, the first ceiling is 3,652.50, followed closely by the 3,649.56 Bollinger upper band and then the 3-month high of 3,663.50. These levels cluster tightly, which means the stock is approaching a decision zone. If it clears that area, the chart would shift from “range near the top” to “potential breakout attempt.” If it fails there, the likely result is a retreat back toward the middle band near 3,472.78, where the market has already shown it is comfortable trading.
The key signal to watch is whether volume remains elevated on any push toward resistance. Strong volume near the top of the range would suggest institutions are still involved. Without that, the stock risks stalling just below the highs.
Technical Verdict: HOLD (wait & see)
HOLD (wait & see) — the trend is positive, but price is now pressing into nearby resistance with momentum that is supportive rather than decisive.
- Reason 1: Price is above the SMA20 at 3,472.78 and SMA50 at 3,359.82, keeping the trend structure constructive.
- Reason 2: MACD is positive and OBV is rising, which supports the idea that buyers are still participating.
- Reason 3: RSI at 59.7 and Stochastic at 55.3/68.1 are neutral, so the chart is not showing a decisive breakout impulse yet.
- Verdict invalidated if price falls below 3,311.00, because that would break the nearest support and weaken the current trend structure.
- Ideal Entry Range: 3,472.78 to 3,311.00
- Exit Target: 3,649.56 to 3,663.50
- Stop Loss protection: below 3,311.00
For non-traders, this means Shell’s chart still looks healthy, but the shares are close enough to resistance that the next move needs proof rather than assumption.
“Until the stock can clear the 3,650 area with conviction, this remains a chart that is asking for confirmation, not celebration.”
Summary Data Shell
| Last price | 3,539.00 GBp |
| Change 1 day / 5 days / 1 month | -0.90% / -0.34% / 2.88% |
| Trend / MA-cross | uptrend / none |
| SMA20 / SMA50 | 3,472.78 / 3,359.82 |
| RSI (14) / Stochastic %K | 59.7 / 55.3 |
| Bollinger %B / ATR | 69% / 65.45 |
| Support / Resistance 20 days | 3,311.00 / 3,652.50 |
| Data as of | 18 September 2026 14:00 WIB |

