DIS Stock Gains 0.85%, Testing Support Level In Focus
On Oktober 5, 2026: price 102.19 USD, trend sideways, RSI 42.4, support 101.33, resistance 108.59. technical analysis of dis stock. DIS Stock Gains — full…

Disney’s shares closed at 102.19 USD on the NYSE, up 0.85% on the day, but the move sits inside a broader patch of weakness: the stock is down 3.73% over 5 days and 4.64% over 1 month, according to Yahoo Finance data cited on 2 October 2026 at 20:30 WIB. What matters here is not just the daily bounce, but where the price sits relative to its trend tools: below the 20-day SMA at 104.98 and below the 50-day SMA at 104.30, with no fresh moving-average crossover to signal a new direction. That combination points to a market that is still leaning cautious, even after the latest uptick.
Trend & Price Action
The chart shows a stock that is not trending cleanly higher or lower so much as drifting sideways with a mild downward bias. The sideways trend and the -0.83%/5 days slope in SMA20 suggest the recent average price is still slipping, which usually means rallies are being sold into rather than broadly embraced. Price at 102.19 USD is also sitting below both SMA20 and SMA50, a technical sign that the market has not yet reclaimed its short- to medium-term footing.
That matters because moving averages often act as a crowd’s memory of value. When price stays under them, traders tend to view rebounds as tests rather than confirmations.
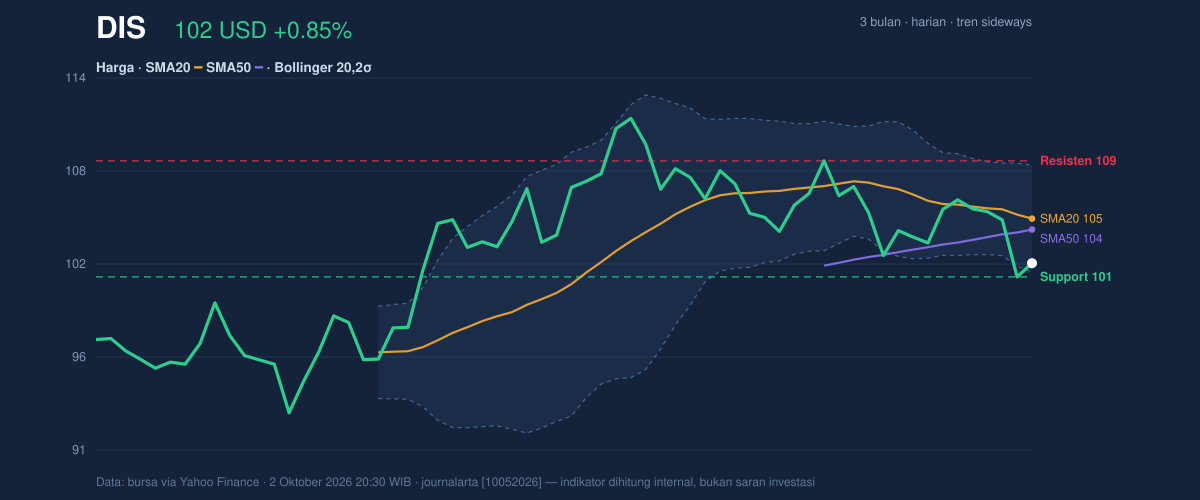
The stock is also positioned near the lower end of its near-term band: the 20-hour support at 101.33 is close by, while 20-hour resistance at 108.59 remains well overhead. With price at about 12% of the range, Disney is trading closer to support than resistance, but not yet in a decisive breakdown zone. The 3-month range of 111.87 to 92.49 reinforces that the name has already absorbed a meaningful swing, and the latest price is closer to the lower half of that span.
Oscillators & Momentum
Momentum indicators are mixed, and that is the key tension in the setup. The RSI at 42.4 is neutral, which means the stock is neither stretched on the upside nor deeply washed out. By itself, that would imply balance. But the Stochastic %K at 14.5 and %D at 17.5 are in oversold territory, which often tells a more tactical story: recent selling has been sharp enough to push short-term momentum near exhaustion, even if the broader trend has not turned.
The MACD at -0.441, with a signal line at 0.022 and a histogram at -0.463, is still negative. In plain language, MACD below zero means the shorter-term trend is weaker than the longer-term one, and the negative histogram says that weakness is still present rather than fading convincingly. So while Stochastic is hinting at a possible near-term bounce, MACD has not yet confirmed that the down-move has ended.
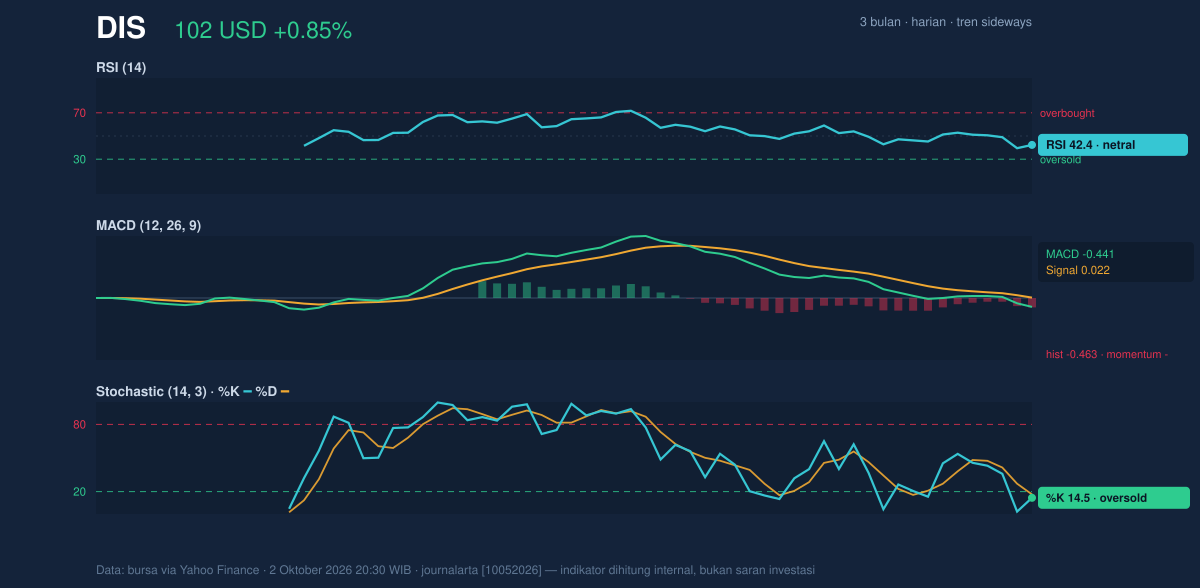
That split is important. Oversold Stochastic readings can mark a rebound window, but without MACD improvement and with RSI still only neutral, the signal is more “pressure may be easing” than “trend has reversed.”
Volatility & Volume
Bollinger Bands are telling a story of compression. The upper band at 108.33, middle at 104.98, and lower at 101.63 frame a 6.4% band width, which is described as narrowing, or squeeze-like. A squeeze matters because it often precedes a larger move, but it does not say which direction. In this case, price at 102.19 USD is sitting just above the lower band, with %B at 8%, which means the stock is trading very near the bottom of its recent volatility envelope. That positioning usually reflects weak near-term demand.
ATR(14) at 2.09, or 2.0% of price, says volatility is moderate rather than explosive. So the setup is compressed, but not dead. A break from this range could still be meaningful if participation returns.
Volume, however, is not yet confirming strength. The latest volume of 6,704,300 is only 0.8× normal versus the 20-day average of 8,662,675, and OBV is declining. That matters because rallies built on lighter-than-normal trading often struggle to hold; declining OBV suggests money flow has not yet decisively turned supportive.
Key Levels & Scenarios
The nearest technical floor is 101.33, and that level deserves attention because it is both a support marker and close to the lower Bollinger boundary at 101.63. If price holds above that zone, the oversold Stochastic reading may have room to translate into a short-term rebound toward the 104.30 to 104.98 area, where both the 50-day and 20-day averages sit. That zone is important because reclaiming it would tell the market that recent selling pressure is being absorbed.
If price fails to hold 101.33, the chart would shift from “compressed and weak” to “compressed and breaking down,” with the next reference coming from the lower end of the broader 3-month range at 92.49. On the upside, a move through 108.59 would start to challenge the current bearish tilt and would also push price back above the upper side of the recent trading band.
Technical Verdict: HOLD (wait & see)
HOLD (wait & see)
- RSI at 42.4 is neutral, so there is no strong trend confirmation either way.
- Stochastic is oversold, which supports rebound risk, but MACD remains negative, so downside momentum has not fully cleared.
- Price is below SMA20 and SMA50, while Bollinger Bands are squeezing, meaning the stock is compressed but not yet showing a confirmed directional break.
Verdict invalidated if price falls below 101.33.
- Ideal Entry Range: 101.33 to 104.30
- Exit Target: 104.98 to 108.59
- Stop Loss protection: below 101.33
For non-traders: the chart says Disney is near a possible turning point, but the trend has not proven that the pressure is over yet. The next move will matter more than the last one.
“If 101.33 gives way, the market will be telling us the floor was thinner than it looked.”
Summary Data DIS
| Last price | 102.19 USD |
| Change 1 day / 5 days / 1 month | 0.85% / -3.73% / -4.64% |
| Trend / MA-cross | sideways / none |
| SMA20 / SMA50 | 104.98 / 104.30 |
| RSI (14) / Stochastic %K | 42.4 / 14.5 |
| Bollinger %B / ATR | 8% / 2.09 |
| Support / Resistance 20 days | 101.33 / 108.59 |
| Data as of | 2 Oktober 2026 20:30 WIB |
Track DIS stock price daily: live levels, support/resistance and our full DIS analysis history.