MRK Stock Analysis: Gains 0.34%, Testing Support Level
On Oktober 5, 2026: price 144.30 USD, trend sideways, RSI 46.1, support 143.79, resistance 150.91. technical analysis of mrk stock. MRK Stock Analysis — full…

Merck is trading in a narrow, uneasy range, with the shares holding above short-term support but still below the 20-day average, a setup that leaves the market waiting for a clearer signal from either buyers or sellers.
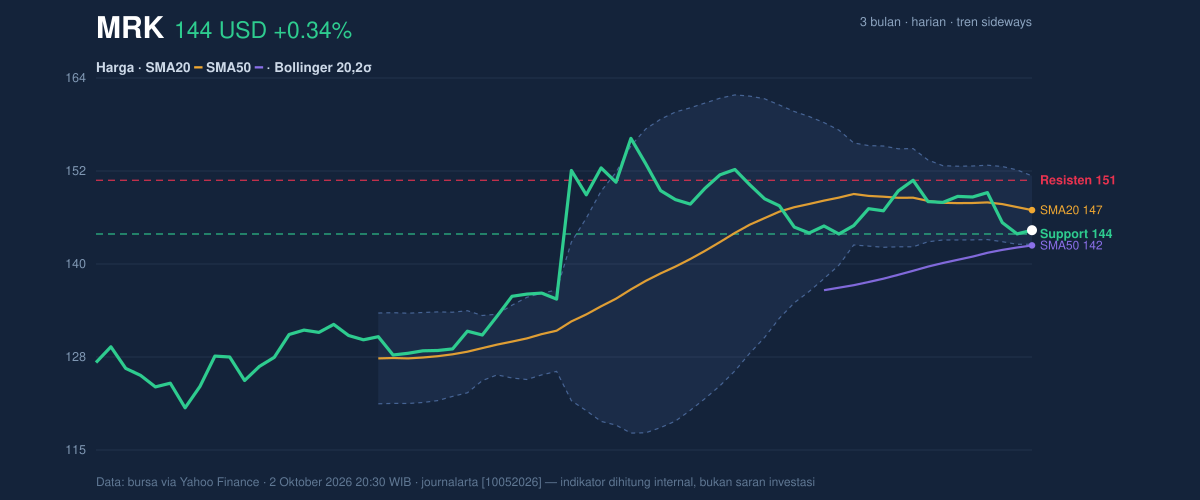
At 144.30 USD, Merck finished slightly above the prior close of 143.81, but the broader message from the tape is less encouraging than that one-day gain suggests. Over the past week the stock is down 3.01%, and over the past month it has fallen 5.28%, which tells investors the recent bounce has not yet changed the direction of travel. The chart shows price sitting below the SMA20 at 146.96 while still above the SMA50 at 142.29, a classic in-between position that usually means the stock is neither in a clean uptrend nor in a confirmed breakdown. With no fresh MA-cross in place and the trend described as sideways, the market is effectively waiting for a catalyst.
Trend & Price Action
The important signal here is not the small daily gain, but where that gain sits inside the structure. Merck is trading near the lower half of its recent band, with price at 144.30 versus support at 143.79 and resistance at 150.91. That means the stock is only a little above the nearest floor, while still several dollars below the ceiling. The chart also shows the price at about 7% of the 20-hour range, which reinforces how close it is to the lower end of the short-term channel.
That matters because sideways markets often punish early enthusiasm: if a stock cannot reclaim the moving average, rallies tend to fade. The SMA20 slope is -0.63% over 5 days, so the short-term trend line is still tilting lower even though the longer SMA50 at 142.29 is acting as a deeper cushion. In plain English, Merck has not broken down, but it has not yet proven it can recover momentum either.
Oscillators & Momentum
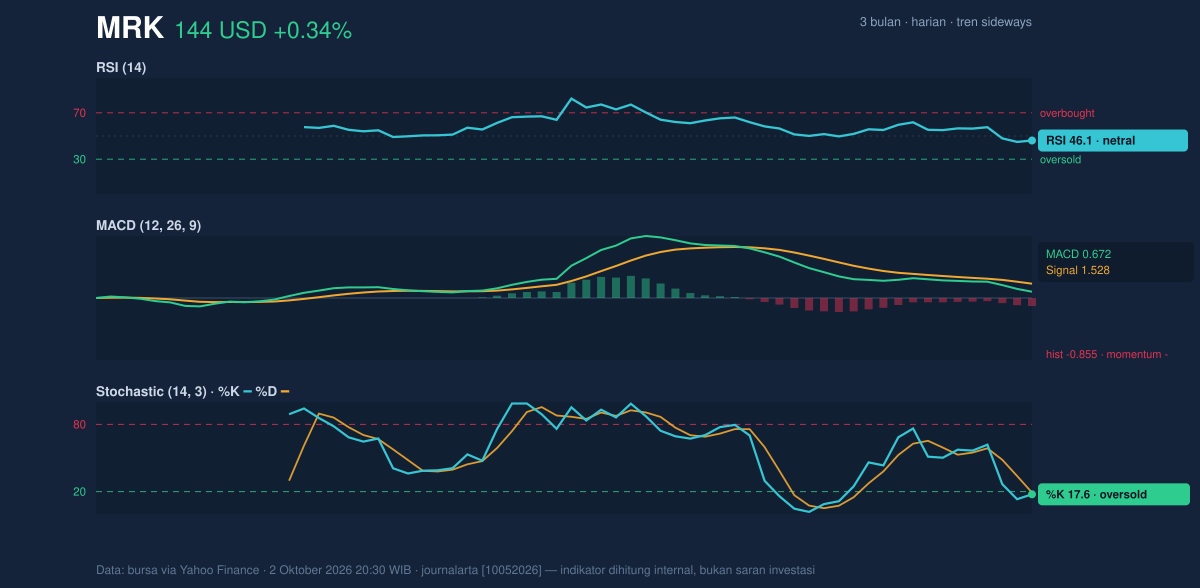
The momentum picture is mixed, and that mix is the reason the stock feels stuck rather than trending. The RSI at 46.1 is neutral, which means the shares are not stretched enough to suggest immediate exhaustion on either side. But the Stochastic at 17.6 / 19.1 is oversold, and that usually signals short-term selling pressure may be getting tired. In other words, the stock is not deeply broken, but it is close to the kind of level where bargain-hunting can appear.
The catch is the MACD at 0.672 versus signal 1.528, with a histogram of -0.855. That negative histogram says downside momentum still has the upper hand, even if the oscillator is not in extreme territory. This is an important distinction: oversold Stochastic does not automatically mean a rebound is imminent; it simply says the decline has likely become more extended in the short run. For now, the momentum tools are not aligned with the broader trend, which keeps the setup cautious.
Volatility & Volume
Bollinger Bands are telling the same story in a different language. The 20-day Bollinger band width is 6.2%, described as a squeeze, which means volatility has contracted. When bands tighten like this, the market often prepares for a larger move, but the direction is not known in advance. The stock is also sitting at %B 21%, which places price near the lower part of the band structure and confirms the shares are leaning toward the weak side of the range.
The ATR at 3.24, or 2.2% of price, points to moderate day-to-day movement, not panic trading. That matters because a squeeze with moderate ATR can still produce a sharp move if a catalyst arrives; it just has not happened yet. Volume adds a crucial check: the latest volume of 9,657,900 is almost exactly in line with the 20-day average of 9,830,375, or 1.0x normal. So the market is not yet showing conviction. The OBV is down, which means volume has been leaning toward distribution rather than accumulation. That is a warning sign: even when the price stabilizes, the underlying participation has not clearly turned supportive.
Key Levels & Scenarios
The immediate technical map is straightforward. 143.79 is the first support to watch, and it sits very close to the current price. If that level fails, the next reference is the SMA50 at 142.29, which would become the more important test of whether the stock can keep its medium-term base intact. On the upside, 146.96 — the SMA20 and Bollinger midline — is the first recovery hurdle. Above that, 150.91 is the near-term resistance that would need to give way before the chart begins to look less defensive.
The message from the levels is simple: Merck is trapped between a nearby floor and a heavier ceiling, and the squeeze in volatility suggests the trap will not last forever. The question is whether the next move comes from a rebound through the moving average or a slip back toward the lower band.
Technical Verdict: HOLD (wait & see)
HOLD (wait & see)
- RSI is neutral at 46.1, so the stock is not oversold enough on its own to confirm a reversal.
- MACD remains negative with a -0.855 histogram, showing downside momentum is still active.
- Stochastic is oversold and Bollinger bands are in a squeeze, which argues for patience rather than chasing either direction before confirmation.
Verdict invalidated if price falls below 142.29, the SMA50 and the next major support reference.
- Ideal Entry Range: 142.29 to 143.79
- Exit Target (Target Price): 146.96 to 150.91
- Stop Loss protection: below 142.29
For non-traders: Merck is not showing a clean trend right now, so the chart is asking for proof before the next meaningful move.
Summary Data MRK
| Last price | 144.30 USD |
| Change 1 day / 5 days / 1 month | 0.34% / -3.01% / -5.28% |
| Trend / MA-cross | sideways / none |
| SMA20 / SMA50 | 146.96 / 142.29 |
| RSI (14) / Stochastic %K | 46.1 / 17.6 |
| Bollinger %B / ATR | 21% / 3.24 |
| Support / Resistance 20 days | 143.79 / 150.91 |
| Data as of | 2 Oktober 2026 20:30 WIB |
Track MRK stock price daily: live levels, support/resistance and our full MRK analysis history.


