Death Cross Pressure, MA Stock Gains 0.41% Today
On Oktober 5, 2026: price 552.26 USD, trend downtrend, RSI 38.6, support 550.00, resistance 579.21. technical analysis of ma stock. Death Cross Pressure — full…

Mastercard (MA) last changed hands at 552.26 USD on the NYSE, up 0.41% from the previous close of 550.00, but the broader tape still points lower: the shares are down 2.71% over 5 days and 5.71% over 1 month, according to market data from Yahoo Finance. That combination matters because a one-day bounce inside a falling structure often says more about short-covering than about a true turn in sentiment. As shown in the chart, the stock is trading below SMA20 at 565.07 and below SMA50 at 570.70, with a death cross already in place — the shorter average has moved under the longer one, a classic signal that recent prices are weakening faster than the medium-term trend can absorb.
Trend & Price Action
The chart shows Mastercard sitting in a downtrend, with SMA20 sloping down -1.34% over 5 days. That slope is important: it means the average itself is still falling, so even rallies have been running into a declining reference point rather than a stable floor. The stock is also positioned near the lower end of its recent range, at 8% of the 20-hour range, which suggests price is spending more time under pressure than in recovery. The 3-month high of 601.23 and 3-month low of 515.11 frame the current move as a retracement that has not yet broken the broader range, but the latest price action leaves little doubt about which side currently has control.
What makes this setup more fragile is that the nearest Bollinger band sits almost exactly under the market.
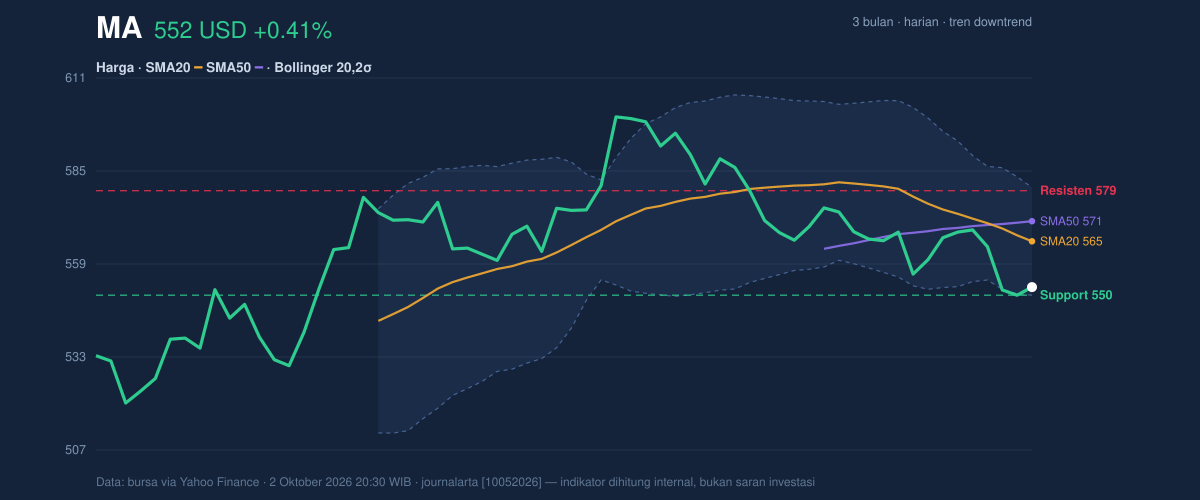
With the Bollinger middle band at 565.07 and the lower band at 550.01, Mastercard is trading just above the lower envelope. In plain English, that means the price is stretched toward the downside of its recent trading range, but not yet in a clean rebound zone. The %B reading of 7% is especially telling: price is hugging the lower edge of the band structure, which often reflects persistent selling pressure rather than healthy consolidation. At the same time, the 5.3% Bollinger width shows the bands are narrowing, a squeeze that can precede a sharper move once the market chooses direction. For now, the direction signal remains bearish because the squeeze is occurring inside an already weak trend.
Oscillators & Momentum
Momentum indicators are not yet screaming oversold enough to force a reversal, but they are clearly not supportive of the bulls. The RSI at 38.6 is still technically neutral, though it sits below the midpoint that often separates balanced trade from weak momentum. The Stochastic %K at 24.0 and %D at 12.0 are also in neutral territory, but the low placement tells us the stock is closing in on the lower part of its recent momentum range. That is not a buy signal by itself; it simply means downside pressure has already done a lot of work. The more decisive reading comes from MACD.
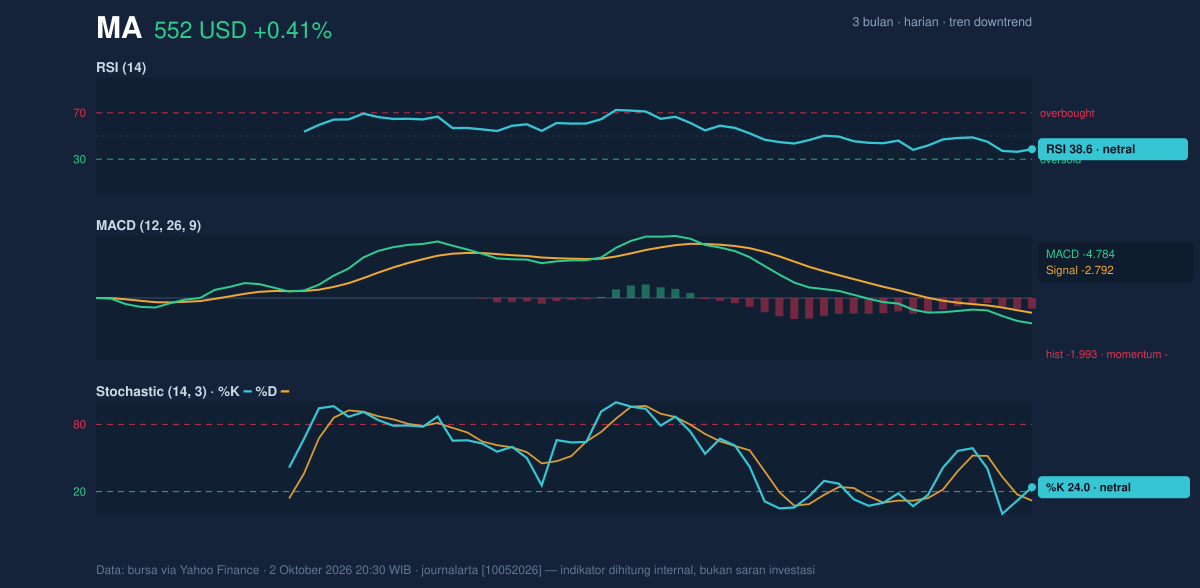
MACD at -4.784 versus a signal line at -2.792, with a histogram of -1.993, confirms negative momentum remains in force. MACD measures the distance between shorter- and longer-term trend momentum; when it stays below the signal line and the histogram is negative, the trend is still leaning down. In other words, the recent bounce is not yet strong enough to change the market’s message. The oscillators are not deeply washed out, which matters: a market that is both weak and oversold can snap back sharply, but Mastercard is only partly there. That leaves room for further price discovery before any durable recovery can be assumed.
Volatility & Volume
Volatility is moderate, with ATR(14) at 8.92, equal to 1.6% of price. ATR, or average true range, is a measure of how much the stock typically moves in a day; this reading suggests Mastercard is not in panic mode, but it is still moving enough to matter over short horizons. The more interesting signal is volume. Last session volume was 2,453,400, below the 20-day average of 2,753,465, or about 0.9x normal. That means the latest bounce happened without broad participation. In market terms, a rise on lighter volume is less convincing than a rise backed by heavier trading because it implies fewer investors were willing to commit at higher prices.
There is one nuance: OBV is rising. On-balance volume tracks whether volume tends to accumulate on up days versus down days, so a rising OBV can hint that money flow is improving even while headline price remains weak. That creates a subtle divergence: price is still below key averages, but underlying participation is not completely absent. It is a sign to watch, not a signal to trust on its own.
Key Levels & Scenarios
The market has already defined the immediate map. Support sits at 550.00, almost exactly where the Bollinger lower band is located at 550.01, making that zone the first line of defense. Above, resistance is 579.21, close to the upper Bollinger band at 580.12. That alignment matters because it shows the market’s current range is boxed in by both price structure and volatility bands. If price can reclaim the 565.07 area, it would at least challenge the idea that the stock is trapped below its short-term trend. If it fails to hold 550.00, the chart opens the door toward the 515.11 3-month low.
Mastercard is still trading as a weak trend with a possible squeeze, not a confirmed reversal.
Technical Verdict: HOLD (wait & see)
- Reason 1: The stock is below SMA20 at 565.07 and below SMA50 at 570.70, with a death cross confirming the trend remains under pressure.
- Reason 2: MACD is negative and the histogram is below zero, so momentum has not yet turned in a meaningful way.
- Reason 3: The Bollinger squeeze and rising OBV suggest a larger move could be coming, but the direction is not confirmed.
- Verdict invalidated if price falls below 550.00, which would break the nearest support and expose the 3-month low at 515.11.
- Ideal Entry Range: 550.00 to 565.07
- Exit Target: 579.21 to 580.12
- Stop Loss protection: below 550.00
For non-traders: the chart says Mastercard is still weak, but the next move could become more decisive if the current squeeze resolves.
“This is the kind of setup where the market is asking a hard question, and the answer has not arrived yet.”
Summary Data MA
| Last price | 552.26 USD |
| Change 1 day / 5 days / 1 month | 0.41% / -2.71% / -5.71% |
| Trend / MA-cross | downtrend / death |
| SMA20 / SMA50 | 565.07 / 570.70 |
| RSI (14) / Stochastic %K | 38.6 / 24.0 |
| Bollinger %B / ATR | 7% / 8.92 |
| Support / Resistance 20 days | 550.00 / 579.21 |
| Data as of | 2 Oktober 2026 20:30 WIB |
Track MA stock price daily: live levels, support/resistance and our full MA analysis history.