PG Stock Technicals Today: Gains 0.67%, Momentum Weakens
On Oktober 5, 2026: price 144.91 USD, trend sideways, RSI 46.5, support 142.64, resistance 149.03. technical analysis of pg stock. PG Stock Technicals — full…

Procter & Gamble (NYSE: PG) traded at 144.91 USD on 2 October 2026 at 20:30 WIB, up 0.67% on the day, but still sitting below both its short- and medium-term trend markers. The stock’s position matters more than the day’s gain: PG is trading below the SMA20 at 146.09 and below the SMA50 at 145.73, which tells the market is still treating rallies as tests of overhead supply rather than the start of a fresh trend. The chart also shows a sideways structure, with the moving average slope barely positive and no fresh moving-average crossover, a setup that usually points to consolidation rather than conviction.
Trend & Price Action
As shown in the chart, PG is holding in the middle-lower part of its recent range, at about 36% of the 20-hour support-resistance band. That means the stock is closer to support than resistance, but not close enough to signal a clean rebound. The 20-hour support at 142.64 is the first level where buyers have recently stepped in, while 149.03 remains the immediate ceiling. The broader three-month range — 154.32 high and 140.20 low — shows PG is still trading well below the upper end of its recent band, so this is less a breakout story than a market waiting for direction.
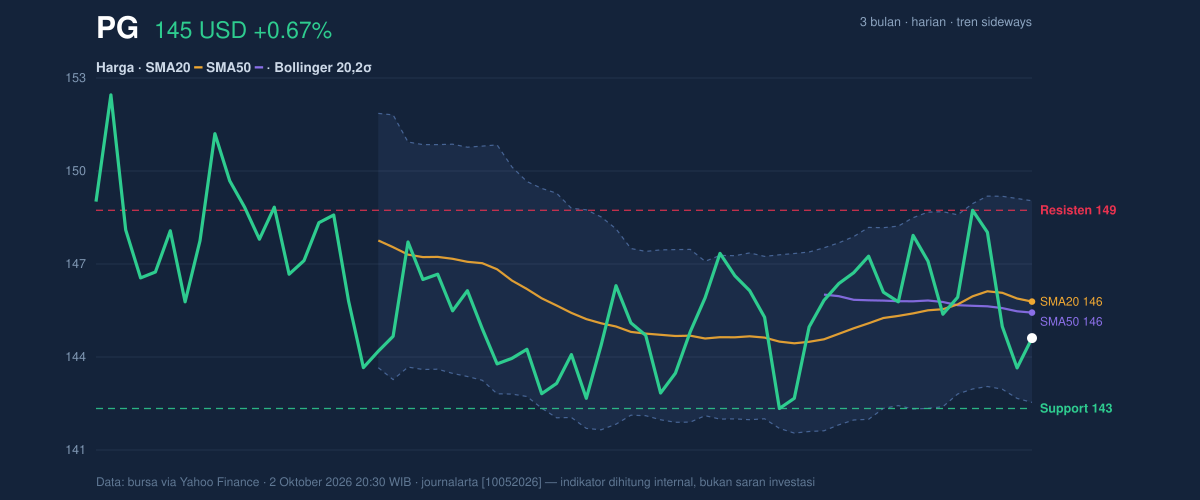
The technical message here is subtle but important: PG is not falling apart, yet it is also not reclaiming lost ground. A stock trading below both SMA20 and SMA50 in a sideways phase often signals that investors are willing to hold the name, but not aggressively add to it until price proves it can stay above the moving averages. That is why the current bounce should be read as a test, not a confirmation.
Oscillators & Momentum
The momentum picture is mixed, and the chart makes that clear. RSI at 46.5 is neutral, which means the stock is neither stretched nor washed out. That is usually a sign of balance, but in this case it also shows a lack of urgency from buyers. The Stochastic %K at 24.8 and %D at 21.0 are near the lower end of the scale, suggesting PG is leaning toward oversold territory without yet flashing a strong reversal. In plain language, the stock has room to recover, but it has not shown the sharp turn that would normally confirm a stronger bounce.
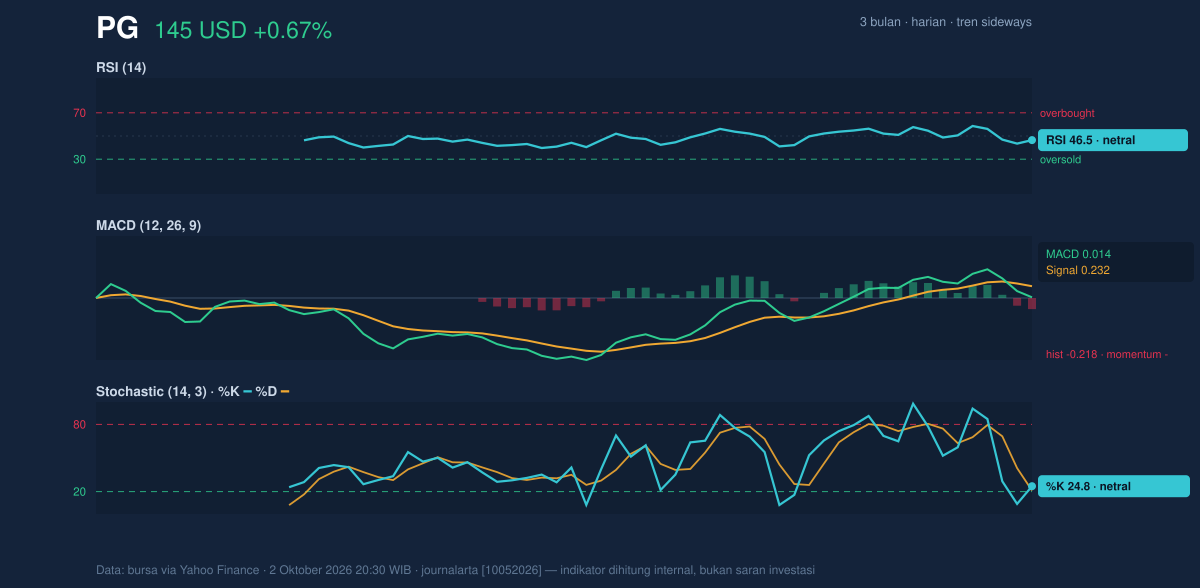
The more cautionary signal comes from MACD at 0.014 versus a signal line at 0.232, leaving a -0.218 histogram. MACD is a trend-following tool, and when it sits below its signal line, it means recent price action is losing pace relative to the prior trend. That negative histogram says momentum is still soft even though the share price rose on the day. Put simply, PG is trying to stabilize, but the momentum tools have not yet endorsed the move.
RSI neutral and Stochastic near oversold together suggest the stock is not overextended, while the MACD remains negative and therefore still argues for caution. That combination is typical of a range-bound stock where traders are watching for a break in either direction rather than assuming one.
Volatility & Volume
Bollinger Bands add another layer to the story. PG is trading inside a relatively tight envelope, with the upper band at 149.34, middle band at 146.09, and lower band at 142.84. The %B at 32% places price in the lower third of the band structure, which means the stock is closer to the downside boundary than the upside boundary. More importantly, the 4.4% band width is narrow and described as a squeeze. That usually means volatility has compressed and a larger move may be building, though the direction is not yet known.
ATR(14) at 2.29, or 1.6% of price, says day-to-day movement is still moderate. That matters because a squeeze with only moderate ATR often precedes a measured break rather than a dramatic one. In other words, the stock is coiling, not exploding.
Volume is not yet confirming the day’s gain. The latest print of 6,248,800 shares is below the 20-day average of 7,985,095, or about 0.8x normal. That means the move higher came without strong participation, which reduces its technical weight. The OBV is down, and that is a useful warning sign: on-balance volume tracks whether money is flowing into or out of a stock, and a falling line while price is trying to stabilize suggests accumulation has not yet taken hold.
Key Levels & Scenarios
The immediate map is straightforward. 142.64 is first support, closely followed by the Bollinger lower band at 142.84. A failure to hold that zone would expose the lower end of the recent range near 140.20. On the upside, 146.09 is the first technical hurdle because it is both the SMA20 and Bollinger middle band, while 149.03 and 149.34 define the next resistance cluster. A move through that area would matter because it would mean PG has absorbed overhead supply and is attempting to leave the current range behind.
For now, PG is a range-trading chart with compressed volatility, weak volume confirmation, and momentum that has not yet turned decisively higher. That is the key signal: the stock is stable enough to avoid a breakdown narrative, but not strong enough to claim trend repair.
Technical Verdict: HOLD (wait & see)
HOLD (wait & see) is the cleanest technical call because the chart is balanced but not resolved.
- MACD remains negative with the histogram below zero, showing momentum is still soft.
- Price is below SMA20 and SMA50, so the stock has not yet reclaimed its short- and medium-term trend lines.
- Bollinger Bands are squeezed, which often precedes a move, but the direction is still unclear and volume is below average.
Verdict invalidated if price breaks below 142.64, because that would put the stock through near-term support and into the lower end of the recent range.
- Ideal Entry Range: 142.84 to 146.09
- Exit Target: 149.03 to 149.34
- Stop Loss Protection: below 142.64
In plain English: PG is not showing enough technical strength yet to prove the recent bounce is durable.
Volume last: 6,248,800 shares versus a 20-day average of 7,985,095.
Summary Data PG
| Last price | 144.91 USD |
| Change 1 day / 5 days / 1 month | 0.67% / -0.90% / -1.37% |
| Trend / MA-cross | sideways / none |
| SMA20 / SMA50 | 146.09 / 145.73 |
| RSI (14) / Stochastic %K | 46.5 / 24.8 |
| Bollinger %B / ATR | 32% / 2.29 |
| Support / Resistance 20 days | 142.64 / 149.03 |
| Data as of | 2 Oktober 2026 20:30 WIB |
Track PG stock price daily: live levels, support/resistance and our full PG analysis history.